


🚀 PANCHASUTRA ASTRO MOMENTUM – Decode Market Moves Through Moon & Mercury Cycles 🌙
Markets don’t move randomly—they move in cycles.
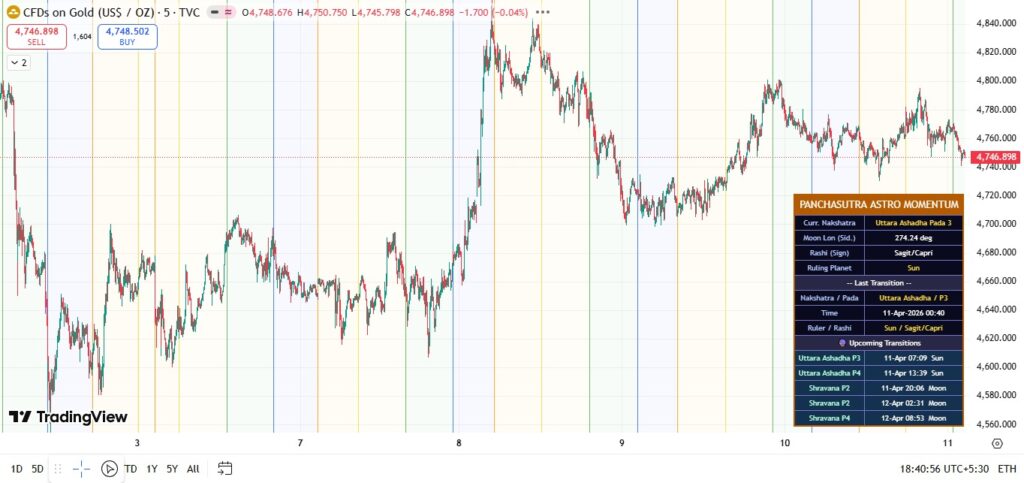
Panchasutra Astro Momentum is a unique indicator built on Chandra Pada Gochar (Moon Cycle logic), designed to help traders identify time-based turning points with precision.
 Whether you are an intraday trader or swing trader, this tool gives you an edge by aligning price with cosmic timing cycles.
 Why This Indicator is Powerful
 Based on Moon Nakshatra & Pada transitions
 Identifies time cycles before price moves
 Works across:
Intraday
Short-term
Medium-term trading Helps you catch reversals, breakouts & momentum shifts
 Gives structured timing—not random signals
 Best Timeframe
5 Minutes (Highly Recommended for Intraday)
Also effective for:
15 min / 30 min → confirmation
Hourly / Daily → swing & positional bias How to Use (Simple Rules)
 Step 1: Watch Cycle Change
When Nakshatra / Pada changes → Expect movement or reversal zone Step 2: Combine with Price Action
At cycle time:
Breakout → Trade with momentum
Reversal pattern → Take opposite trade Step 3: Follow Directional Bias
Strong trend + cycle alignment = high probability trade Intraday Strategy (5 Min Chart)
At each cycle line / timing:
Wait for candle confirmation
Enter on:
Breakout above high → BUY
Breakdown below low → SELL
Exit:
30–80 points (index) or based on volatility
Or next cycle timing
 What Makes It Different?
Most indicators show price lagging signals Panchasutra Astro Momentum shows TIME first, MOVE later
🚀 PANCHASUTRA ASTRO MOMENTUM – Decode Market Moves Through MARS Cycles 🌙
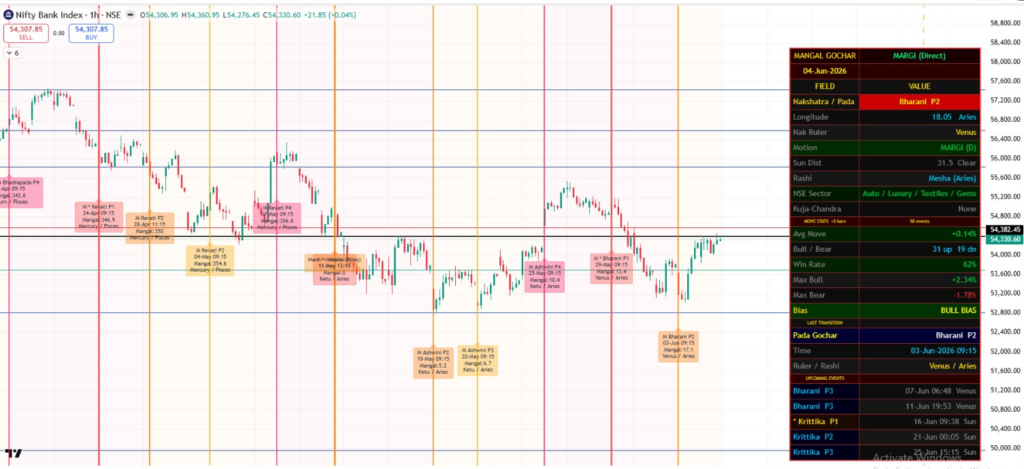
PANCHASUTRA – Mars Cycle & Gochar Analysis Dashboard
The Panchasutra Mars Cycle Indicator is a specialized astro-market analytical tool designed to track and interpret the impact of Mars (Mangal) on financial markets. In traditional market astrology, Mars is widely regarded as one of the most influential planets governing momentum, volatility, aggression, risk-taking behavior, and trend acceleration. Significant Mars events frequently coincide with important intermediate tops, bottoms, reversals, and trend continuation phases in the market.
This indicator systematically tracks and displays all major Mars-related astrological transitions, allowing traders to anticipate potential periods of heightened market activity and directional shifts.
Key Features
✅ Complete Mars Event Tracking
- Rashi Parivartan (Sign Change)
- Retrograde (Vakri) Motion
- Direct (Margi) Motion
- Station Dates
- Nakshatra & Pada Gochar Transitions
- Planetary Ruler Changes
- Mars Longitude & Zodiac Position Monitoring
✅ Historical Market Behavior Analysis
For every Mars transition, the dashboard studies historical market performance and provides:
- Bull vs Bear occurrence statistics
- Win Rate percentage
- Average move after the event
- Maximum bullish move
- Maximum bearish move
- Event-specific directional bias
✅ Forward Event Calendar
The indicator continuously displays upcoming Mars transitions, helping traders prepare in advance for potentially important market turning points.
✅ Dynamic Support & Resistance Mapping
Major Mars transitions often coincide with the creation of important swing highs and swing lows. These levels frequently evolve into key support and resistance zones that traders can monitor throughout the cycle.
Why Mars Matters in Market Analysis
Mars represents energy, action, aggression, competition, and momentum. In financial markets, these qualities often manifest as:
- Sudden directional moves
- Increased volatility
- Trend acceleration
- Sharp reversals near extremes
- Expansion in trading ranges
Historically, many significant Mars events have aligned with intermediate-term market tops and bottoms, making Mars cycles particularly valuable for swing traders, positional traders, and market timing enthusiasts.
While Mars events should not be used as standalone trading signals, combining them with price action, volume analysis, market profile, and technical structure can significantly enhance a trader’s ability to identify high-probability turning points.
The Panchasutra Edge
Unlike conventional astrology indicators that merely display planetary positions, Panchasutra bridges the gap between astrology and market statistics by quantifying how markets have historically behaved during specific Mars transitions. This enables traders to make objective, data-backed decisions rather than relying solely on astrological interpretations.
Panchasutra Mars Cycle Dashboard — Where Planetary Cycles Meet Market Statistics.
🚀 PANCHASUTRA ASTRO MOMENTUM – Decode Market Moves Through MERCURY Cycles 🌙
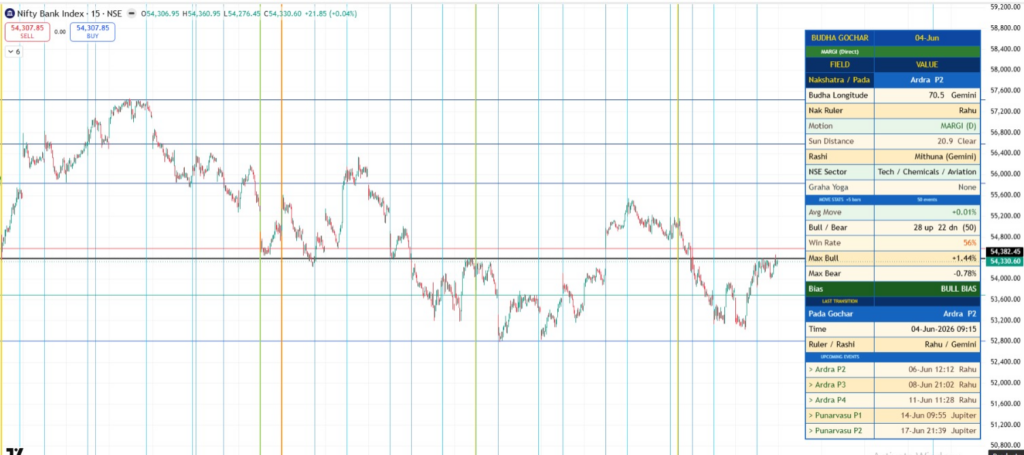
PANCHASUTRA – Mercury Cycle & Gochar Analysis Dashboard
The Panchasutra Mercury Cycle Indicator is a specialized astro-market analytical tool designed to track and interpret the impact of Mercury (Budh) on financial markets. In traditional market astrology, Mercury is widely regarded as one of the most influential planets governing communication, information flow, trading activity, market sentiment, speculation, decision-making, and short-term price movements. Significant Mercury events frequently coincide with important market reversals, trend shifts, consolidation breakouts, and periods of heightened trading activity.
This indicator systematically tracks and displays all major Mercury-related astrological transitions, allowing traders to anticipate potential periods of increased market responsiveness and directional change.
Key Features
✅ Complete Mercury Event Tracking
- Rashi Parivartan (Sign Change)
- Retrograde (Vakri) Motion
- Direct (Margi) Motion
- Station Dates
- Nakshatra & Pada Gochar Transitions
- Planetary Ruler Changes
- Mercury Longitude & Zodiac Position Monitoring
- Combust and Emerging Phases
- Mercury Speed Variations & Transit Strength Analysis
✅ Historical Market Behavior Analysis
For every Mercury transition, the dashboard studies historical market performance and provides:
- Bull vs Bear occurrence statistics
- Win Rate percentage
- Average move after the event
- Maximum bullish move
- Maximum bearish move
- Event-specific directional bias
✅ Forward Event Calendar
The indicator continuously displays upcoming Mercury transitions, helping traders prepare in advance for potentially important market turning points and periods of increased trading activity.
✅ Dynamic Support & Resistance Mapping
Major Mercury transitions often coincide with the formation of significant swing highs and swing lows. These levels frequently evolve into important support and resistance zones that traders can monitor throughout the cycle.
Why Mercury Matters in Market Analysis
Mercury represents intelligence, communication, information exchange, commerce, analysis, and rapid decision-making. In financial markets, these qualities often manifest as:
- Increased trading volume
- Faster information-driven price movements
- Short-term trend reversals
- Breakouts from consolidation zones
- Speculative activity and sentiment shifts
- Enhanced market responsiveness to news and data releases
Historically, many significant Mercury events have aligned with key turning points, trend transitions, and volatility expansions, making Mercury cycles particularly valuable for active traders, swing traders, derivatives traders, and market timing enthusiasts.
While Mercury events should not be used as standalone trading signals, combining them with price action, volume analysis, market profile, sentiment indicators, and technical structure can significantly improve a trader’s ability to identify high-probability opportunities.
The Panchasutra Edge
Unlike conventional astrology indicators that merely display planetary positions, Panchasutra bridges the gap between astrology and market statistics by quantifying how markets have historically behaved during specific Mercury transitions. This enables traders to make objective, data-backed decisions rather than relying solely on astrological interpretations.
By transforming planetary movements into actionable market intelligence, the Panchasutra Mercury Cycle Dashboard helps traders better understand the relationship between information cycles and market behavior.
Panchasutra Mercury Cycle Dashboard — Where Planetary Intelligence Meets Market Statistics
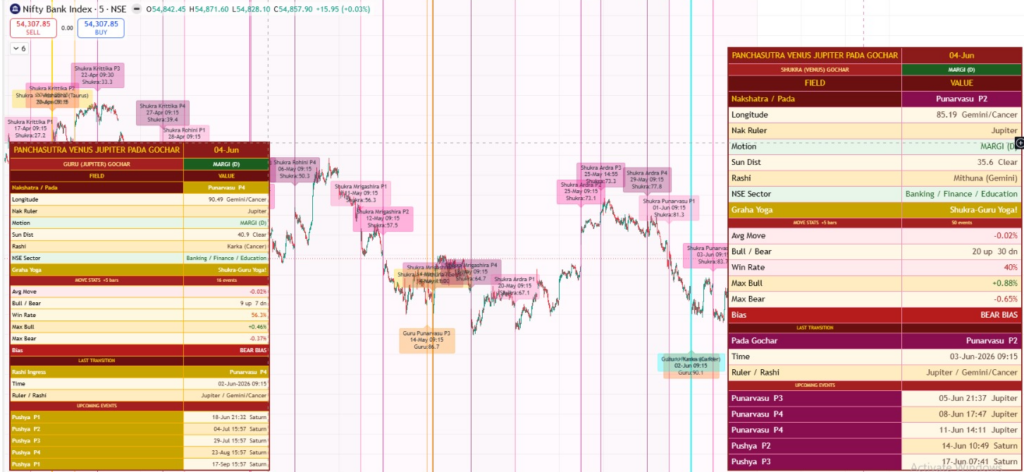
🚀 PANCHASUTRA ASTRO MOMENTUM – Decode Market Moves Through JUPITER & VENUS COMBO Cycles 🌙
PANCHASUTRA – Jupiter Venus Cycle & Gochar Analysis Dashboard
The Panchasutra Jupiter Venus Cycle Indicator is a specialized astro-market analytical tool designed to track and interpret the combined influence of Jupiter (Guru) and Venus (Shukra) on financial markets. In traditional market astrology, Jupiter and Venus are considered two of the most powerful benefic planets governing growth, wealth creation, liquidity, optimism, valuation, investor confidence, and capital expansion.
When these two planets undergo important transitions or form significant planetary relationships, markets often experience notable shifts in trend strength, sentiment, and medium-to-long-term directional bias. Major Jupiter-Venus events frequently coincide with important market bottoms, sustained rallies, accumulation phases, and significant trend continuation cycles.
This indicator systematically tracks and displays all major Jupiter and Venus-related astrological transitions, allowing traders and investors to identify periods where planetary cycles may align with meaningful market opportunities.
Key Features
✅ Complete Jupiter & Venus Event Tracking
- Guru (Jupiter) Nakshatra Transitions
- Guru (Jupiter) Pada Transitions
- Shukra (Venus) Nakshatra Transitions
- Shukra (Venus) Pada Transitions
- Retrograde (Vakri) Motion Tracking
- Direct (Margi) Motion Tracking
- Station Dates
- Planetary Ruler Changes
- Longitude & Zodiac Position Monitoring
- Jupiter-Venus Confluence Detection
- Future Gochar Event Projection
✅ Historical Market Behavior Analysis
For every Jupiter and Venus transition, the dashboard studies historical market performance and provides:
- Bull vs Bear occurrence statistics
- Win Rate percentage
- Average move after the event
- Maximum bullish move
- Maximum bearish move
- Historical reliability scores
- Event-specific directional bias
✅ Jupiter–Venus Confluence Analysis
One of the most unique features of the dashboard is the identification of Guru-Shukra Confluence Zones.
When Jupiter and Venus transitions occur within close proximity of one another, markets often enter periods of heightened significance where sentiment, liquidity, valuation, and trend direction may undergo substantial change.
The indicator automatically highlights these high-probability confluence windows, allowing traders to focus on potentially important market turning points.
✅ Forward Event Calendar
The dashboard continuously displays upcoming Jupiter and Venus transitions, enabling traders to prepare for future planetary events before they occur.
This forward-looking calendar helps market participants anticipate periods where historical market behavior suggests increased probability of directional movement or trend development.
✅ Dynamic Support & Resistance Mapping
Major Jupiter and Venus transitions frequently align with important swing highs and swing lows.
These planetary turning points often develop into critical support and resistance zones that remain relevant throughout the ongoing market cycle.
The dashboard automatically visualizes these levels, allowing traders to integrate planetary timing with technical analysis.
Why Jupiter and Venus Matter in Market Analysis
Jupiter represents expansion, prosperity, optimism, institutional growth, and long-term wealth creation.
Venus represents value, money flow, financial comfort, market attractiveness, liquidity, and investor sentiment.
Together, these two planets often influence:
- Long-term bullish market phases
- Capital inflows and liquidity expansion
- Investor confidence and optimism
- Trend continuation cycles
- Accumulation and distribution phases
- Wealth-creation opportunities
- Major market bottoms and recovery rallies
Historically, many significant Jupiter-Venus events have aligned with important market inflection points, making these cycles particularly valuable for positional traders, swing traders, investors, and market timing enthusiasts.
While planetary events should never be used as standalone trading signals, combining Jupiter-Venus cycle analysis with price action, volume studies, market profile, trend structure, and risk management techniques can significantly enhance market timing decisions.
The Panchasutra Edge
Unlike conventional astrology indicators that merely display planetary positions, Panchasutra bridges the gap between astrology and market statistics by quantifying how markets have historically behaved during specific Jupiter and Venus transitions.
By combining planetary timing, historical probability studies, confluence analysis, and objective statistical validation, traders gain a structured framework for understanding how celestial cycles may interact with market behavior.
This transforms traditional astrological observations into practical, data-driven market intelligence.
Panchasutra Jupiter Venus Cycle Dashboard — Where Wealth Cycles Meet Market Statistics
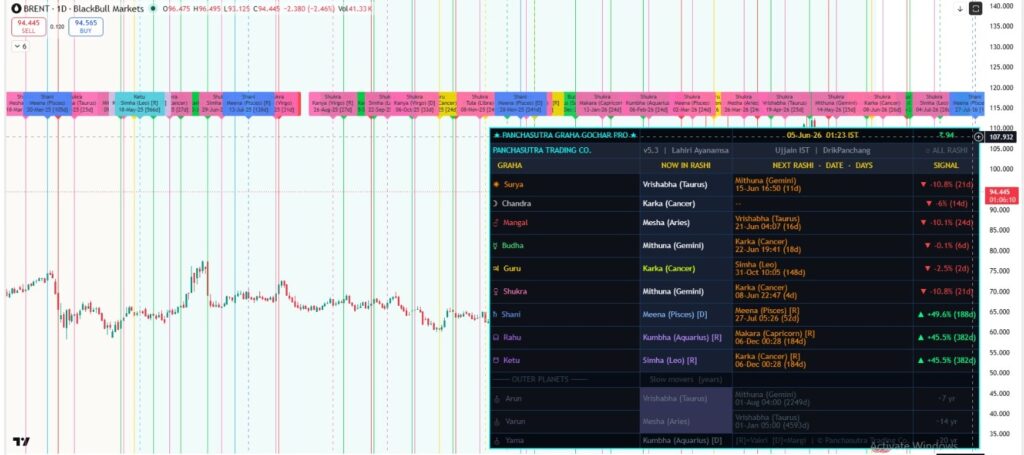
🚀 PANCHASUTRA ASTRO MOMENTUM – Decode Market Moves Through PLANETARY MOVEMENT CYCLES 🌙
PANCHASUTRA Graha Gochar Pro Dashboard
The Panchasutra Graha Gochar Pro Dashboard is a comprehensive planetary transit monitoring system designed for traders, investors, astrologers, and market cycle enthusiasts who seek to track the real-time movement of planets through the zodiac. Unlike traditional transit tools that focus solely on planetary positions, Graha Gochar Pro provides a structured and actionable view of where each planet is currently placed, when its next major transit will occur, and how these transitions may influence market behavior and timing cycles.
The dashboard offers a complete snapshot of all major planetary movements, allowing users to instantly identify current zodiac placements, upcoming sign changes, retrograde and direct transitions, and long-term planetary cycle developments from a single centralized interface.
Key Features
✅ Real-Time Planetary Position Tracking
Monitor the current zodiac location of all major planets, including:
- Sun (Surya)
- Moon (Chandra)
- Mercury (Budha)
- Venus (Shukra)
- Mars (Mangal)
- Jupiter (Guru)
- Saturn (Shani)
- Rahu
- Ketu
- Outer Planets (Uranus, Neptune, Pluto/Yama)
✅ Upcoming Transit Intelligence
The dashboard continuously calculates and displays:
- Next Rashi (Sign) Change
- Upcoming Transit Date & Time
- Days Remaining Until Transit
- Retrograde (Vakri) Transitions
- Direct (Margi) Transitions
- Long-Term Planetary Cycle Shifts
This forward-looking approach enables traders and analysts to prepare well in advance for important planetary events.
✅ Market Performance Insights
Each planetary transition can be linked with historical market behavior, helping users identify periods where previous transits coincided with:
- Trend reversals
- Volatility expansion
- Major tops and bottoms
- Momentum acceleration
- Sentiment shifts
- Time-cycle turning points
✅ Dynamic Planetary Filters
Users can selectively focus on specific zodiac signs and planetary positions, making it easier to isolate and study the impact of particular transits on market behavior.
✅ Professional Market Timing Framework
By combining planetary movement data with price action, technical analysis, volume studies, and market structure, traders gain a powerful timing framework for identifying potential opportunity windows and cycle inflection points.
Why Planetary Transit Tracking Matters
Planetary transits represent the continuous movement of celestial bodies through the zodiac and form the foundation of financial astrology and cycle analysis. Every planetary shift introduces a new energetic environment that can influence market psychology, sentiment, liquidity, momentum, and trend development.
Historically, many major market turning points have occurred near significant planetary transitions, making transit monitoring an essential component of astro-financial research.
Understanding where a planet is today—and where it will move next—provides valuable context for anticipating future market conditions and identifying potential periods of increased market activity.
The Panchasutra Edge
Unlike conventional astrology software that simply displays planetary positions, Panchasutra transforms planetary transit data into an organized decision-support system tailored for market participants.
By combining current planetary locations, upcoming transit schedules, cycle countdowns, and market-focused analysis into a single professional dashboard, traders can stay ahead of important celestial events and integrate planetary timing into their broader trading framework.
Panchasutra Graha Gochar Pro Dashboard — Your Complete Planetary Transit Command Center
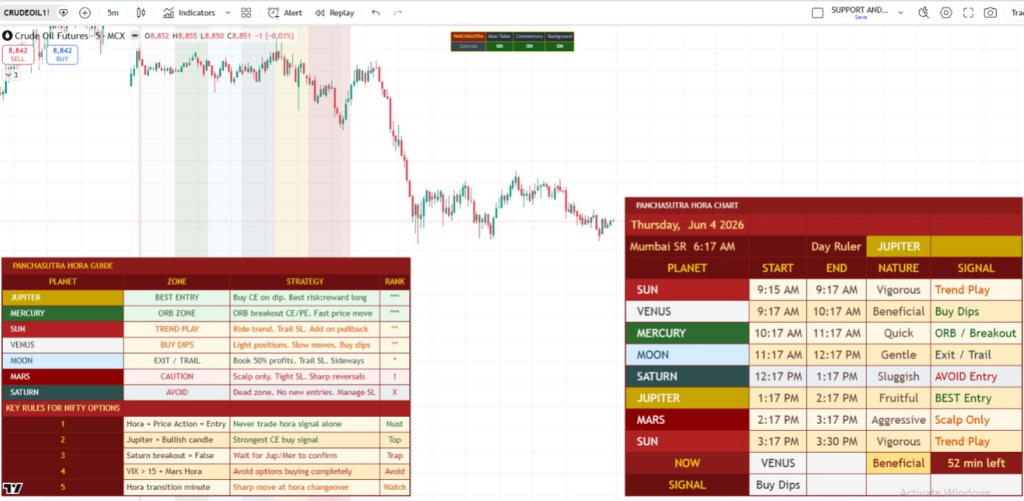
🚀 PANCHASUTRA ASTRO MOMENTUM – Decode Market Moves Through HORA TIMINGS
PANCHASUTRA Hora Trading Dashboard
The Panchasutra Hora Trading Dashboard is a specialized market timing tool designed to integrate the ancient wisdom of planetary Hora cycles with modern trading and price action analysis. Based on the traditional Vedic concept of Hora, each trading day is divided into planetary time segments, with every Hora carrying a unique market energy that can influence trader behavior, momentum, volatility, and market direction.
The dashboard helps traders identify which planetary influence is active during the trading session and provides a structured framework for aligning trading decisions with favorable market conditions.
Key Features
✅ Real-Time Hora Tracking
The dashboard continuously monitors and displays:
- Current Active Hora
- Start & End Time of Each Hora
- Planetary Ruler of the Hora
- Planetary Nature & Strength
- Intraday Signal Bias
- Remaining Time in Current Hora
This enables traders to instantly understand the prevailing market energy and adapt their strategies accordingly.
✅ Planet-Specific Trading Framework
Each planetary Hora is associated with unique market characteristics:
- Jupiter (Guru) – Expansion, confidence, strong bullish opportunities
- Mercury (Budha) – Fast moves, breakout trades, momentum setups
- Sun (Surya) – Trend continuation and directional strength
- Venus (Shukra) – Smooth trends, accumulation, buy-on-dips behavior
- Moon (Chandra) – Sentiment-driven moves, profit booking, trend transitions
- Mars (Mangal) – Aggressive volatility, sharp reversals, scalping opportunities
- Saturn (Shani) – Slow movement, uncertainty, risk-control phase
✅ Actionable Trading Guidance
Rather than simply displaying Hora timings, the dashboard translates planetary influences into practical trading strategies such as:
- Trend Following
- Breakout Trading
- Scalping Opportunities
- Buy-on-Dips Zones
- Profit Booking Windows
- Risk Reduction Periods
- Avoidance Zones
✅ Market Timing Intelligence
The indicator highlights periods where historical market behavior suggests:
- Higher probability trend continuation
- Increased momentum
- Sharp intraday reversals
- Volatility expansion
- Low-probability trading environments
- Potential entry and exit windows
✅ Integrated Trading Rules
The dashboard combines Hora cycles with price action principles to create a disciplined decision-making framework. Traders receive clear guidance on when to:
- Initiate new positions
- Hold winning trades
- Trail stop losses
- Scale into trends
- Avoid low-probability setups
- Protect profits during uncertain periods
Why Hora Matters in Trading
Financial markets are driven by cycles of momentum, sentiment, participation, and trader psychology. Hora analysis provides a time-based framework that helps traders understand when certain market characteristics are more likely to dominate.
Historically, different planetary Horas often coincide with distinct market behaviors:
- Momentum expansion during Mercury and Jupiter Horas
- Strong trend development during Sun Hora
- Increased volatility during Mars Hora
- Consolidation and caution during Saturn Hora
- Sentiment-driven shifts during Moon Hora
By understanding these recurring intraday cycles, traders can better align their entries, exits, and risk management decisions with prevailing market conditions.
The Panchasutra Edge
Unlike traditional Hora calculators that merely display planetary hours, Panchasutra transforms Hora cycles into a practical trading intelligence system.
The dashboard combines planetary timing, market behavior analysis, and strategy-based guidance to help traders identify favorable trading windows while avoiding periods that historically produce poor risk-reward opportunities.
This allows traders to use time as an additional edge alongside price action, technical analysis, volume studies, and market structure.
Panchasutra Hora Trading Dashboard — Where Planetary Time Cycles Meet Market Timing
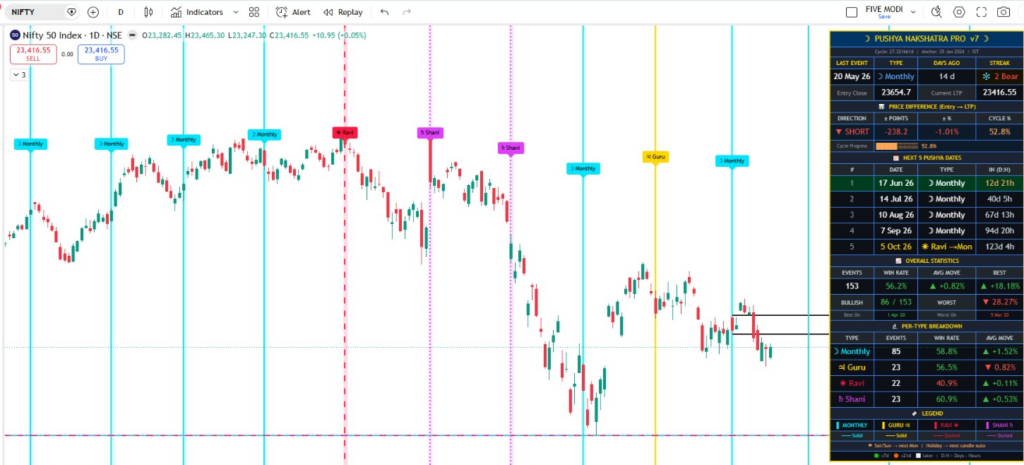
🚀 PANCHASUTRA PUSHYA DATES INDICATOR (RAVI, GURU & MONTHLY)
PANCHASUTRA Pushya Nakshatra PRO Dashboard
Where Cosmic Timing Meets Precision Trading Intelligence
The Panchasutra Pushya Nakshatra PRO Dashboard is an advanced market timing and behavioral analysis tool that blends the time-tested principles of Vedic astrology with modern trading analytics. Built around the powerful Pushya Nakshatra cycles, this indicator transforms celestial timing into actionable trading intelligence—helping traders decode hidden market rhythms and align their strategies with high-probability opportunities.
Pushya Nakshatra has long been regarded as one of the most auspicious and influential cosmic periods. In financial markets, it often coincides with significant shifts in sentiment, momentum, and trend behavior. Panchasutra leverages this phenomenon and converts it into a structured, data-driven trading framework.
🔶 Core Philosophy: Timing is the Invisible Edge
Markets are not random—they move in cycles of accumulation, expansion, distribution, and correction. While price action shows what is happening, time reveals when it is likely to happen.
The Pushya Nakshatra PRO Dashboard is designed to give traders this missing dimension—time-based conviction.
🚀 Key Features of Panchasutra Pushya Nakshatra PRO
✅ Smart Nakshatra Event Tracking
The dashboard automatically identifies and highlights:
- Monthly Pushya Nakshatra cycles
- Guru Pushya (Thursday alignment)
- Ravi Pushya (Sunday alignment)
- Shani Pushya (Saturday alignment)
Each event is visually plotted on charts, helping traders instantly spot critical time zones of market activity.
✅ Dynamic Market Behavior Analysis
Instead of just marking dates, the indicator provides deep insights such as:
- Directional Bias (Bullish / Bearish tendencies)
- Historical Win Rates
- Average Move after Pushya events
- Best & Worst outcomes
- Cycle performance consistency
This transforms raw timing into probability-backed decision-making.
✅ Event-Based Trading Intelligence
Every Pushya cycle is analyzed to identify:
- Potential trend continuation zones
- Reversal probability windows
- Volatility expansion phases
- Consolidation or breakout behavior
This allows traders to anticipate moves instead of reacting late.
✅ Advanced Dashboard Analytics Panel
The beautifully structured dashboard provides:
- Last Pushya event details
- Days since last occurrence
- Current price vs entry reference
- Cycle strength indicators
- Streak analysis (Bullish/Bearish continuation)
All critical information is available at a glance—no clutter, only clarity.
✅ Structured Trading Framework
Panchasutra doesn’t just show data—it tells you what to do with it:
- When to enter trades
- When to stay patient
- When to ride momentum
- When to book profits
- When to reduce risk exposure
This builds discipline, consistency, and confidence.
📊 How Pushya Nakshatra Influences Markets
Historically, Pushya cycles tend to align with specific market behaviors:
- Momentum Expansion after consolidation phases
- Trend Continuation during strong cycles
- Sharp Reversals at exhaustion points
- Institutional Activity Zones (smart money footprints)
- Volatility Spikes creating trading opportunities
By tracking these cycles, traders gain a timing advantage that most market participants ignore.
🧠 The Panchasutra Edge
What makes this tool truly powerful is its ability to combine:
- Cosmic Time Cycles (Nakshatra Analysis)
- Price Action & Market Structure
- Statistical Performance Tracking
- Real Trading Applications
Unlike traditional astrology-based tools, Panchasutra transforms ancient knowledge into a modern trading system built for real markets.
🎯 Who Should Use This Dashboard?
- Intraday Traders seeking timing precision
- Swing Traders looking for high-probability zones
- Positional Traders tracking cycle-based trends
- Astro-Traders combining time + price
- Serious traders who want an edge beyond indicators
⚡ Final Thought
In trading, price tells the story—but time decides the outcome.
The Panchasutra Pushya Nakshatra PRO Dashboard empowers traders to align with powerful market cycles, avoid low-probability trades, and capitalize on moments when the market is most likely to move.
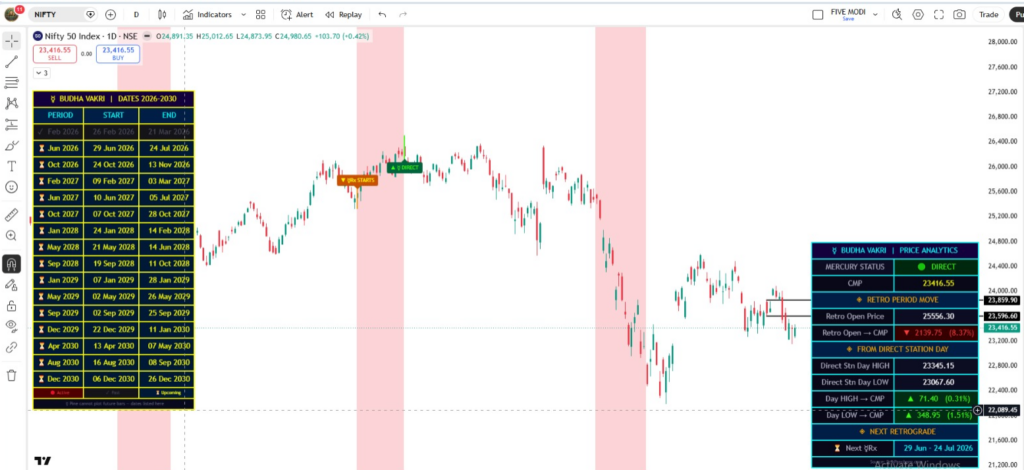
🚀 PANCHASUTRA MERCURY GOCHAR
PANCHASUTRA Mercury Gochar PRO Dashboard
Mastering Market Movements Through Planetary Transits
The Panchasutra Mercury Gochar PRO Dashboard is a cutting-edge trading intelligence system designed to decode the impact of Mercury (Budha) transits and retrograde cycles on financial markets. By blending ancient Vedic astrology with modern price analytics, this dashboard empowers traders to anticipate momentum shifts, trend disruptions, and volatility spikes with precision.
Mercury, the planet of communication, speed, and intelligence, plays a crucial role in market behavior—especially in intraday momentum, breakout activity, and sudden reversals. Panchasutra transforms these cosmic movements into a structured, data-backed trading framework.
🔶 Core Philosophy: Decode Speed, Control Volatility
Markets often accelerate, stall, or reverse without warning. These behavioral shifts are not random—they frequently align with Mercury’s directional changes, especially during retrograde and direct transitions.
The Mercury Gochar PRO Dashboard helps traders understand:
- When markets are likely to move fast
- When confusion and false signals may dominate
- When clarity and trend direction return
This gives traders a timing advantage beyond traditional indicators.
🚀 Key Features of Panchasutra Mercury Gochar PRO
✅ Complete Mercury Cycle Tracking
The dashboard continuously monitors:
- Mercury Direct & Retrograde Phases
- Start & End Dates of Each Cycle
- Upcoming Gochar (Transit) Periods
- Historical Cycle Data (Multi-Year View)
This allows traders to prepare in advance for high-impact time windows.
✅ Retrograde vs Direct Market Intelligence
The system clearly distinguishes between:
🔴 Mercury Retrograde Phase
- Increased market noise
- False breakouts & whipsaws
- Sudden reversals
- Emotional & erratic trading behavior
🟢 Mercury Direct Phase
- Clearer trends
- Strong breakout confirmations
- Smoother directional moves
- Better follow-through
✅ Advanced Price Analytics Panel
The dashboard doesn’t stop at astrology—it integrates real market data:
- Current Market Price (CMP)
- Retro Period Price Move (%)
- Direct Phase High & Low Levels
- Distance of CMP from key levels
- Performance tracking from cycle start
This bridges the gap between cosmic timing and actual price action.
✅ Event-Based Trading Framework
Each Mercury cycle is translated into actionable strategies:
- During Retrograde → Focus on risk control & quick trades
- During Direct Phase → Focus on trend riding & breakouts
- Transition Periods → Watch for major reversals or trend shifts
This ensures traders are always aligned with the dominant market energy.
✅ Multi-Year Cycle Dashboard
The left-side panel provides a structured table of:
- Mercury Retrograde periods (2026–2030 and beyond)
- Exact start & end dates
- Clear visual classification (Past / Active / Upcoming)
This enables long-term traders to plan positional strategies with confidence.
📊 How Mercury Gochar Impacts Markets
Mercury cycles often align with key behavioral patterns:
- Fast Momentum Moves during strong direct phases
- Choppy & Uncertain Markets during retrograde
- Fake Breakouts & Trap Moves in reversal zones
- Sharp Directional Shifts near transition periods
- High Trading Opportunities for Scalpers during volatility spikes
Understanding these patterns allows traders to adapt rather than react.
🧠 The Panchasutra Edge
Unlike generic astro tools, Panchasutra builds a complete trading ecosystem around Mercury cycles:
- Planetary Transit Timing
- Historical Market Behavior Analysis
- Real-Time Price Integration
- Strategy-Based Decision Framework
This converts astrology into a professional-grade trading system.
🎯 Who Should Use This Dashboard?
- Intraday Traders (for momentum & scalping)
- Swing Traders (for trend timing)
- Breakout Traders (to avoid false signals)
- Astro-Traders (combining time + price)
- Serious market participants seeking a unique edge
⚡ Final Thought
In trading, speed can be your greatest advantage—or your biggest enemy.
The Panchasutra Mercury Gochar PRO Dashboard helps you understand when to trust the move and when to question it.
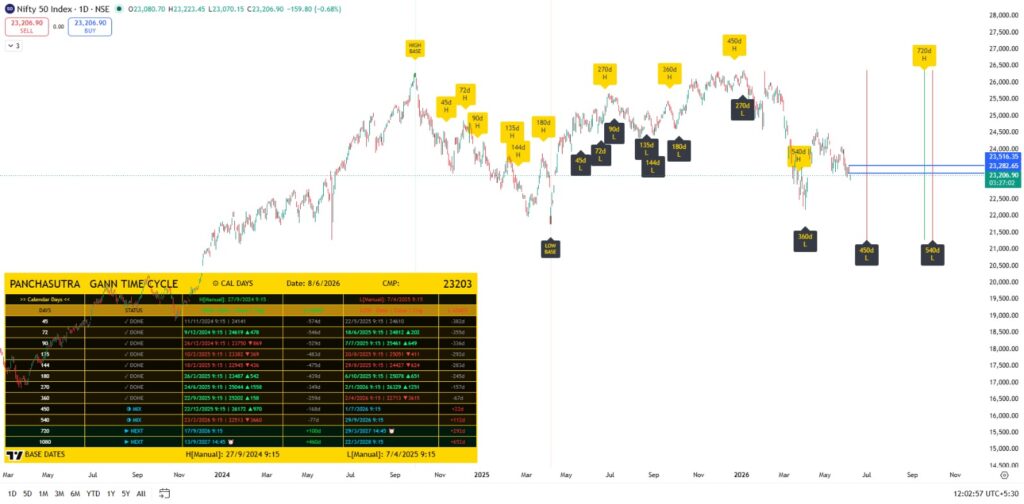
🚀 PANCHASUTRA GANN TIME CYCLE INDICATOR
PANCHASUTRA Gann Time Cycle PRO Dashboard
Decoding Market Turns Through the Power of Time Cycles
The Panchasutra Gann Time Cycle PRO Dashboard is a precision-based market timing tool inspired by the legendary principles of W.D. Gann, designed to identify high-probability turning points using time cycles. By integrating classic Gann theory with modern charting flexibility, this dashboard empowers traders to forecast when the market is likely to react—before the move actually unfolds.
Unlike traditional indicators that focus only on price, this system emphasizes time as the dominant force, helping traders anticipate trend shifts, reversals, and momentum phases with clarity.
🔶 Core Philosophy: Time Controls Price
Markets move not just based on levels—but on time cycles repeating in structured intervals. Gann believed that specific time counts (like 45, 90, 180, 360 days) often align with major market reactions.
The Panchasutra Gann Time Cycle PRO transforms this concept into a dynamic, customizable trading system, allowing traders to project critical dates with precision.
🚀 Key Features of Panchasutra Gann Time Cycle PRO
✅ Flexible Cycle Calculation Engine
The dashboard allows multiple powerful methods to calculate time cycles:
Manual Base Date Selection
→ Define your own important swing high/lowAuto High/Low Detection (N Bars)
→ Automatically pick significant highs/lows from recent dataCalendar-Based Calculation
→ Generate cycles from a fixed historical date
This flexibility ensures the tool adapts to your trading style and strategy.
✅ Comprehensive Time Cycle Mapping
The indicator calculates and tracks key Gann cycles such as:
45 Days
72 Days
90 Days
135 Days
144 Days
180 Days
270 Days
360 Days
540 / 720 / 1080 Days
Each cycle is plotted directly on the chart, helping traders visualize future time-based reaction zones.
✅ Dual Cycle Framework (High & Low Bases)
The system uniquely supports:
🔵 High-Based Cycles → Identify potential tops or resistance timing
🔴 Low-Based Cycles → Identify potential bottoms or accumulation zones
This dual approach provides a complete 360° market timing perspective.
✅ Smart Status Tracking Dashboard
The built-in table clearly categorizes cycles into:
✅ Completed (Done)
🔄 Active / Mixed Cycles
⏭ Upcoming (Next High-Probability Dates)
Each cycle also shows:
Exact projected date & time
Days remaining or passed
Cycle strength & alignment
This helps traders stay ahead of the market, not behind it.
✅ Visual Time Projection on Charts
All important cycle dates are:
Marked on the chart
Highlighted for easy visibility
Aligned with price structure
This creates a powerful combination of time + price confluence zones.
📊 How Gann Time Cycles Influence Markets
Time cycles often align with critical market behavior:
Trend Reversals near major cycle completions
Momentum Acceleration at mid-cycle expansions
Consolidation Phases before big moves
Institutional Activity Zones around key time counts
When multiple cycles cluster together, they form high-impact time windows—often leading to explosive moves.
🧠 The Panchasutra Edge
What sets this tool apart:
Combines classic Gann theory with modern automation
Offers multi-method flexibility (manual + auto + calendar)
Integrates real-time chart plotting with cycle analytics
Provides a clear decision-making framework
This is not just a cycle calculator—it’s a complete time-based trading system.
🎯 Practical Trading Applications
With Panchasutra Gann Time Cycle PRO, traders can:
Anticipate trend reversal zones
Prepare for major breakout timing
Align trades with cycle completions
Avoid entries during low-probability time windows
Combine with price action for high-conviction setups
👥 Who Should Use This Dashboard?
Swing Traders tracking medium-term cycles
Positional Traders planning long-term entries
Intraday Traders identifying reaction days
Gann Theory Practitioners
Serious traders who understand that timing is everything
⚡ Final Thought
Most traders focus only on where to trade.
Professionals know the real edge lies in when to trade.
The Panchasutra Gann Time Cycle PRO Dashboard gives you that edge—by turning time into your most powerful trading weapon.
PANCHASUTRA — Where Time Predicts the Move Before Price Confirms It
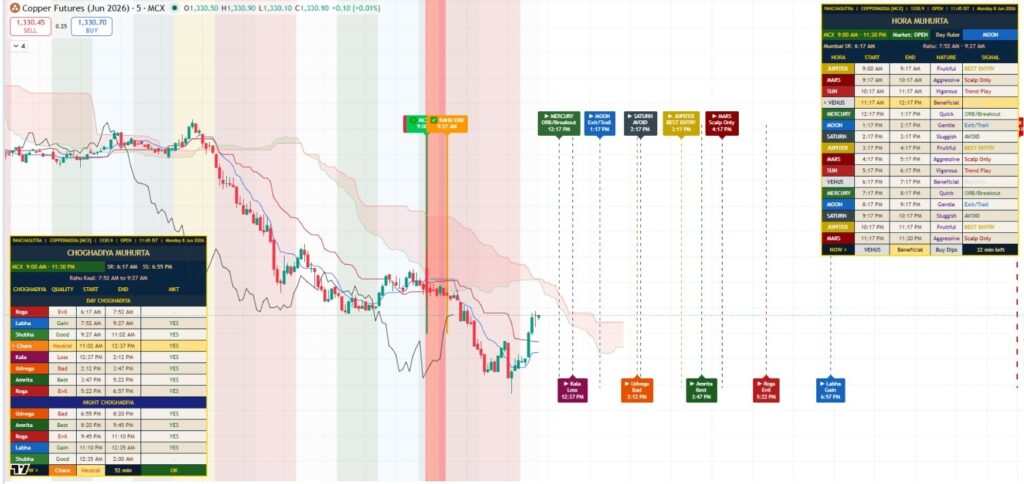
🚀 PANCHASUTRA HORA MAHURAT AND CHOGHADIYA TIMINGS
PANCHASUTRA Muhurt PRO Dashboard (Hora + Choghadiya Intelligence)
The Ultimate Time-Based Trading Engine for Intraday Precision
The Panchasutra Muhurt PRO Dashboard is a powerful fusion of Hora (planetary hours) and Choghadiya (auspicious time segments)—crafted to give traders a complete time-based trading advantage. This is not just an indicator—it’s a real-time decision-making system that aligns market activity with cosmic timing cycles and behavioral probabilities.
By combining two of the most respected Vedic time frameworks, Panchasutra delivers a high-precision intraday trading roadmap, helping traders understand when to trade, when to avoid, and when to maximize profits.
🔶 Core Philosophy: Right Trade at the Right Time
Most traders focus on setup—but ignore timing.
Panchasutra Muhurt PRO answers the most important question:
👉 “Is this the right time to trade?”
By integrating Hora and Choghadiya, the dashboard identifies:
Favorable trading windows
Risky time zones
Momentum phases
Reversal periods
This transforms trading from guesswork into timing-based execution.
🚀 Key Features of Panchasutra Muhurt PRO
✅ Dual Time Intelligence Engine (Hora + Choghadiya)
🔷 Hora Dashboard (Planetary Influence)
Tracks the ruling planet of each hour and its impact on market behavior:
Moon → Sentiment & exits
Mars → Volatility & scalping
Mercury → Breakouts & fast moves
Jupiter → Strong entries
Venus → Smooth trends
Saturn → Slow / avoid
Sun → Trend continuation
Each Hora comes with Nature + Actionable Signal like:
✔ Best Entry
✔ Trend Play
✔ Scalping Only
✔ Avoid
🔶 Choghadiya Dashboard (Time Quality Filter)
Classifies time into powerful categories:
🟢 Amrit / Shubh / Labh → High probability trading zones
🟡 Chara → Neutral / momentum-dependent
🔴 Rog / Kaal / Udveg → Risky / avoid zones
This ensures you only trade when time quality supports your setup.
✅ Real-Time Market Session Mapping
The dashboard dynamically displays:
Market Open / Close timings (MCX, Equity, etc.)
Sunrise & Sunset (for accurate time calculation)
Rahu Kaal (high-risk avoidance zone)
Active Hora & Choghadiya
Remaining time in current cycle
This gives traders complete situational awareness.
✅ Visual Time Zoning on Charts
Color-coded vertical zones mark different time energies
Red Zones → High caution / volatility
Green Zones → Favorable trading windows
Neutral Zones → Wait-and-watch
This allows traders to visually align price action with time cycles.
✅ Actionable Trading Signals
Instead of raw data, Panchasutra gives clear guidance:
BEST ENTRY → High conviction setups
TREND PLAY → Ride momentum
ORB/BREAKOUT → Fast execution trades
SCALP ONLY → Quick in & out
EXIT/TRAIL → Protect profits
AVOID → Stay out of market
This creates a disciplined trading framework.
✅ Integrated Risk Management Zones
Special time filters like:
Rahu Kaal → Avoid major decisions
Low-quality Choghadiya → Reduce position size
Saturn Hora → Capital protection mode
Helps traders preserve capital during unfavorable periods.
📊 How Hora + Choghadiya Impacts Markets
When both systems align, they create high-probability trading zones:
🟢 Strong Hora + Good Choghadiya → Explosive moves & clean trends
🟡 Mixed Signals → Choppy / range-bound markets
🔴 Weak Hora + Bad Choghadiya → False breakouts & traps
This dual-layer filtering dramatically improves trade quality and timing accuracy.
🧠 The Panchasutra Edge
What makes this a true “GEM Indicator”:
Combines Planetary Cycles + Time Quality Filters
Converts ancient timing systems into modern trading signals
Provides real-time actionable insights—not just data
Enhances price action strategies with timing confirmation
This is where astro + logic + execution meet.
🎯 Who Should Use This Dashboard?
Intraday Traders (perfect timing execution)
Scalpers (high-speed decision making)
Options Traders (timing volatility)
Astro-Traders (time + price synergy)
Traders seeking consistency and discipline
⚡ Final Thought
A good setup at the wrong time fails.
An average setup at the right time wins.
The Panchasutra Muhurt PRO Dashboard ensures you trade when the market energy is in your favor.
PANCHASUTRA — Don’t Just Trade the Market, Trade the Time Behind It
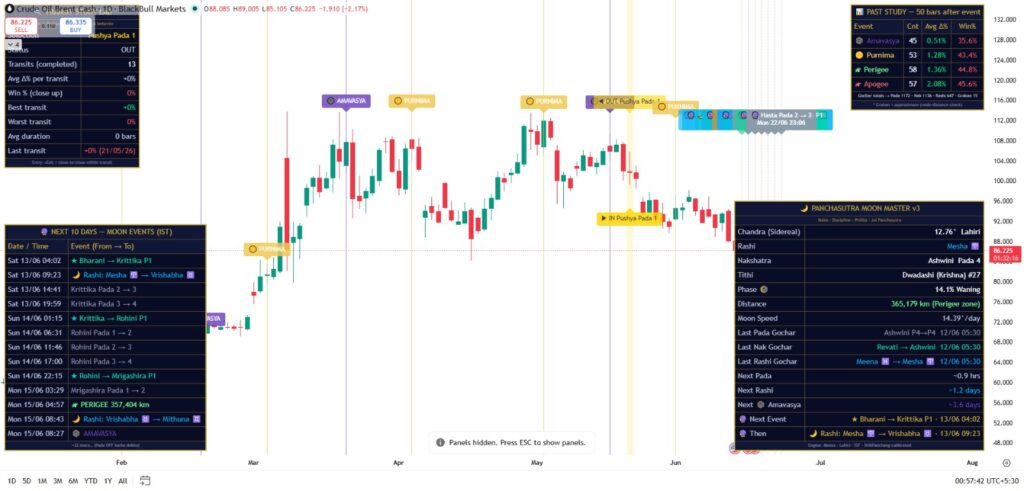
🚀 PANCHASUTRA MOON MASTER
Moon Master Indicator (PTC Moon / Panchasutra Moon Master v3) ek astro-based trading indicator hai jo market ko Moon (Chandra) ke movements ke basis par analyze karta hai. Simple language me samjho toh:
🔮 Ye indicator kya karta hai?
Ye indicator Moon ki poori journey track karta hai, jaise:
🌙 Nakshatra change (Ashwini, Rohini, Pushya, etc.)
🪐 Rashi change (Mesha, Vrishabha, etc.)
🔁 Pada transitions
🌑🌕 Amavasya / Purnima
📉 Perigee / Apogee (Moon distance from Earth)
⚡ Transit timings (IN / OUT signals)
👉 Matlab: Moon kis position me hai aur kab change karega — sab capture karta hai.
📊 Chart par kya dikhta hai?
Tumhare screenshot me jo dikh raha hai, usme:
1. Vertical Lines / Zones
Yellow / Blue zones → Moon events ya transitions
In zones me market me volatility ya reversal aata hai
2. IN / OUT Signals
“IN Pushya Pada 1” jaise labels
Entry / Exit timing ka hint dete hain
3. Moon Events Table
Next 10 days ke events:
Nakshatra change
Rashi change
Amavasya / Purnima
4. Study Panel (Right Side)
Current Moon position:
Nakshatra: Pushya
Rashi: Karka
Phase: Waning / Waxing
Next event timing bhi show karta hai
🧠 Iska logic kya hai?
Astrology ke hisaab se:
Moon = emotions + liquidity + sentiment
Jab Moon position change karta hai:
Market sentiment shift hota hai
Trend reversal ya spike aa sakta hai
👉 Isliye ye indicator time-based analysis deta hai (price nahi, timing important)
📈 Trading me kaise use kare?
✔️ Best Use:
Intraday timing
Swing reversal points
Volatility prediction
✔️ Strategy idea:
Moon event zone ke paas:
Reversal expect karo
Strong trend me:
Event ke baad continuation bhi ho sakta hai
⚠️ Important baat
Ye standalone indicator nahi hai
Price action + support/resistance + volume ke saath use karo
Sirf Moon ke basis pe blindly trade mat karo
💡 Simple summary
👉 “Moon Master indicator market ke timing aur sentiment shifts ko track karta hai, Moon ke movement ke through.”
Agar chaho toh main tumhe is indicator ki ek proper trading strategy (entry + exit rules) bhi bana ke de sakta hoon 👍