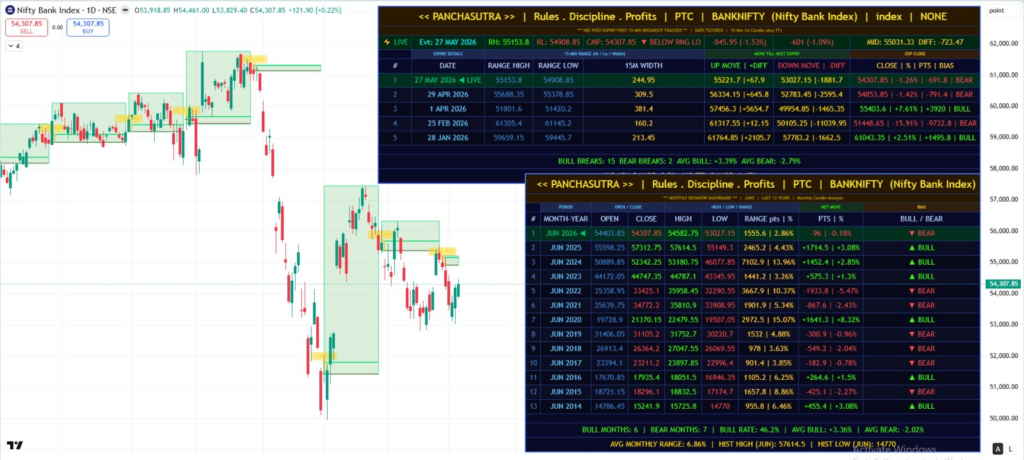



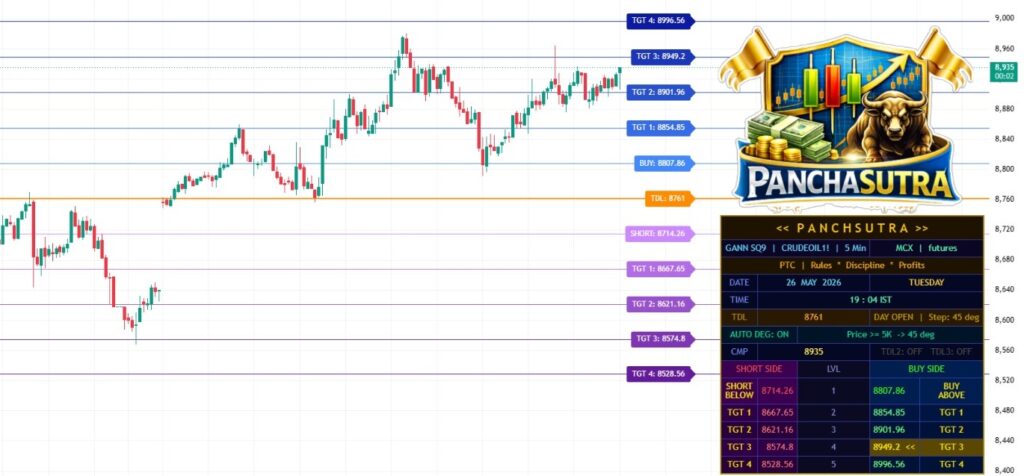
 Panchasutra Mazic Levels – Precision Trading Made Simple
Turn market noise into clear opportunities with Panchasutra Mazic Levels, based on W D Gann Sq of 9, designed for both Intraday & Swing Traders.
 Identify high-probability Buy & Short zones instantly as soon as market opens Pre-defined Targets (TGT 1–4 and more) for disciplined profit booking Strong TDL (Trend Decision Level) to manage risk smartly Helps you avoid overtrading and focus on planned execution
 How to Use:
Best to work on 5 Mins Time frame for intraday.
Buy above the BUY level and trail targets step-by-step
Short below the SHORT level and follow downside targets
Use TDL as your stop-loss guide for better risk management
Perfect for traders who want clarity, structure, and consistency
 Trade with confidence. Trade with levels. Trade with Panchasutra Mazic Levels.
Stop guessing the market.
Start trading structure + timing.
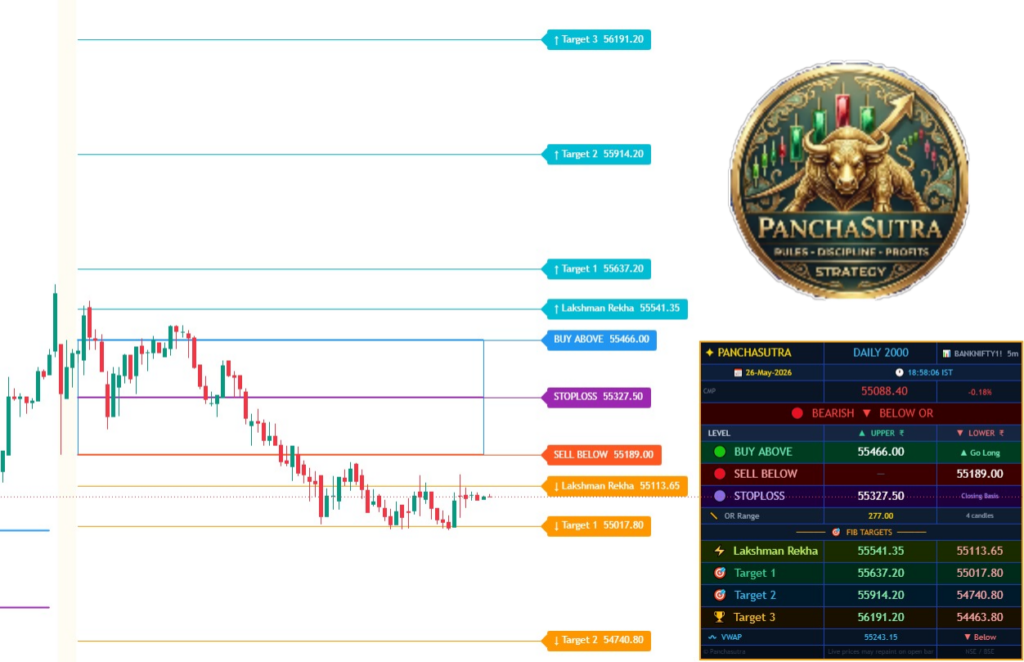
Introducing Panchasutra Daily 2000 —
A powerful Opening Range Breakout indicator designed to capture explosive moves right when they begin.
 This is not just another indicator…
This is your range breakout weapon 
 Identifies perfect opening range
 Tracks real breakout zones
 Helps capture high momentum moves (2000+ potential in index trading)
Jab range break hoti hai… Tabhi banta hai real paisa
 HOW TO TRADE (PRO METHOD)
Step 1: Mark the Range
Use first 15–30 minutes opening range
Indicator will automatically define it
Step 2: Wait for Breakout (No Jaldi  )
) BUY TRADE
Price breaks range high
Candle closes above breakout
RSI > 50
Price above EMA
Entry: Breakout candle / slight retest SL: Range low SELL TRADE
Price breaks range low
RSI < 50
Price below EMA
Entry: Breakdown candle SL: Range high
 ENTRY FILTER (SECRET EDGE)
Only take trade when:
 Breakout + RSI confirmation Price aligned with EMA Good candle body (no weak breakout)
This avoids fake breakouts
TARGET & EXIT 30–100 points (safe intraday) or as defined by indicator itself Trail for bigger moves (2000+ option potential)
 IMPORTANT RULES
Don’t trade inside range Avoid low volume days No overtrading
“Ek strong breakout > 10 random trades”
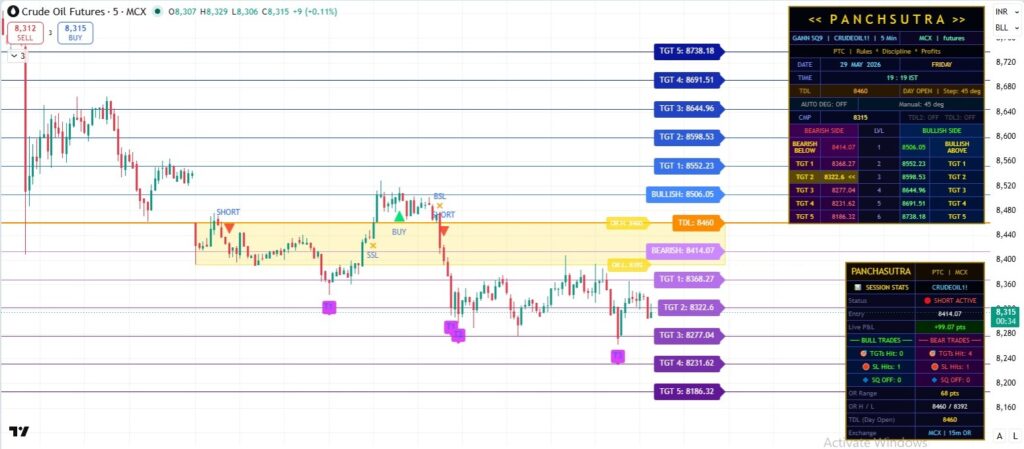
Panchasutra Mazic Levels PRO – Precision Trading Made More Simple
With Trade Alert & Current Trade Status Window
Turn market noise into clear opportunities with Panchasutra Mazic Levels, based on W D Gann Sq of 9, designed for both Intraday & Swing Traders.
Q. What makes it different from Panchasutra Mazic Level indicato?
Ans. 1.The Trade alert on your charts. 2. Current ongoing trade status live. 3. The Opening Range Box.
Identify high-probability Buy & Short zones instantly as soon as market opens Pre-defined Targets (TGT 1–4 and more) for disciplined profit booking Strong TDL (Trend Decision Level) to manage risk smartly Helps you avoid overtrading and focus on planned execution
How to Use:
Best to work on 5 Mins Time frame for intraday.
Buy above the BUY level and trail targets step-by-step
Short below the SHORT level and follow downside targets
Use TDL as your stop-loss guide for better risk management
Perfect for traders who want clarity, structure, and consistency
Trade with confidence. Trade with levels. Trade with Panchasutra Mazic Levels Pro.