




Understanding the Power of Trend Lines Through W.D. Gann’s Principles of Price and Time
“The market moves in price, but its rhythm unfolds through time.”
Introduction: The Hidden Geometry Behind Market Movements
Financial markets may appear unpredictable, but beneath their continuous fluctuations lies a fascinating relationship between price, time, momentum, and market structure.
One of the most influential pioneers in exploring this relationship was William Delbert Gann (W.D. Gann), a legendary market analyst who developed trading techniques based on mathematical proportions, geometric angles, price cycles, and time relationships.
Gann believed that understanding the relationship between price and time could provide valuable insights into market trends and potential turning points.
Among the many tools available to technical analysts, trend lines remain one of the simplest yet most powerful instruments for understanding market direction.
However, when we examine trend lines through Gann’s geometric principles, their significance extends beyond ordinary support and resistance.
They become a framework for studying the balance between price movement and the passage of time.
1. Trend Lines: The Foundation of Market Structure
A trend line is a straight line connecting significant price points on a chart to identify the prevailing direction of the market.
In an upward-trending market, a trend line is generally drawn by connecting important higher lows. In a downward-trending market, it connects significant lower highs.
These lines help traders understand three essential characteristics of market behaviour:
- Direction: Whether buyers or sellers are dominating the market.
- Strength: Whether the prevailing trend is accelerating, maintaining its pace, or weakening.
- Structure: Whether price continues to respect its established pattern of movement.
A rising trend line represents an area where buying interest has repeatedly emerged, while a falling trend line highlights areas where selling pressure has previously appeared.
The real importance of a trend line lies not merely in its slope but in how price behaves when it approaches, respects, or breaks that line.
A trend line is not a prediction. It is a visual representation of the market’s existing behaviour.
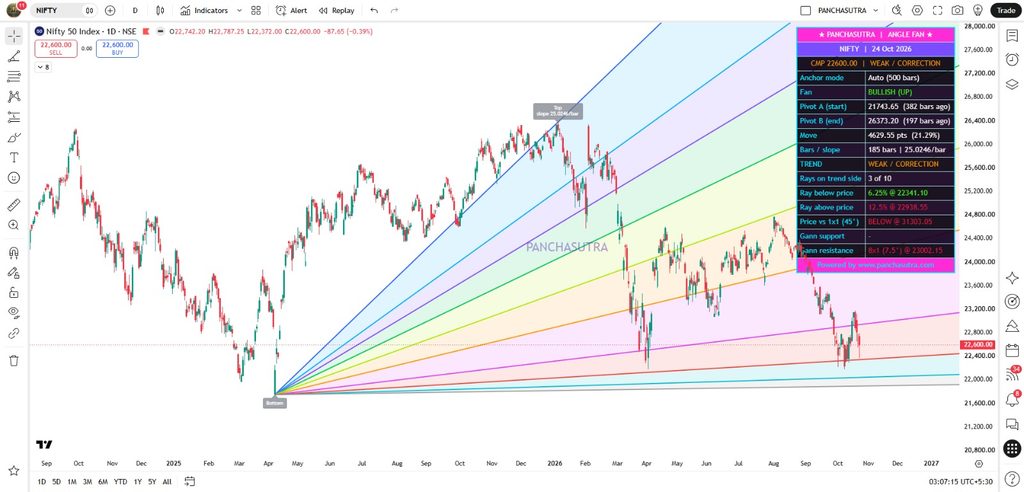
2. W.D. Gann’s Geometric Approach: Where Price Meets Time
Traditional trend lines are drawn using visible swing highs and lows. Gann’s approach introduced an additional dimension: the geometric relationship between price and time.
Gann studied market movements through predefined angular relationships, commonly represented by Gann angles.
The most widely recognised is the 1×1 angle, which represents one unit of price movement for one unit of time.
Other important Gann angles include:
| Gann Angle | Price–Time Relationship | Geometric Interpretation |
|---|---|---|
| 1×8 | 1 price unit per 8 time units | Very gradual rise |
| 1×4 | 1 price unit per 4 time units | Gradual rise |
| 1×2 | 1 price unit per 2 time units | Moderate rise |
| 1×1 | 1 price unit per 1 time unit | Balanced movement |
| 2×1 | 2 price units per 1 time unit | Stronger rise |
| 4×1 | 4 price units per 1 time unit | Steep rise |
| 8×1 | 8 price units per 1 time unit | Very steep rise |
These descriptions apply to rising angles; corresponding descending angles can be used to study declining markets.
An important technical distinction must be understood: the 1×1 angle is geometrically 45 degrees only when the chart’s price and time scales are calibrated appropriately. Changing chart zoom or axis scaling can alter the visual appearance of an angle.
Therefore, proper scaling is essential when applying Gann geometry.
3. The 1×1 Angle: Understanding Market Balance
Within Gann analysis, the 1×1 angle occupies a particularly important position.
It represents a predefined balance between the rate of price change and the passage of time.
When price remains above a rising 1×1 angle drawn from a significant low, Gann practitioners generally interpret this as evidence that the market is maintaining a constructive upward structure.
Conversely, sustained movement below that angle may indicate a weakening trend.
However, breaking a 1×1 angle does not automatically establish a complete trend reversal.
It may simply indicate that the market is transitioning from one rate of movement to another.
For example, a market that loses its rising 1×1 angle may begin respecting the slower 1×2 or 1×4 angle.
This introduces an important concept:
A change in the speed of a trend is not necessarily a change in its direction.
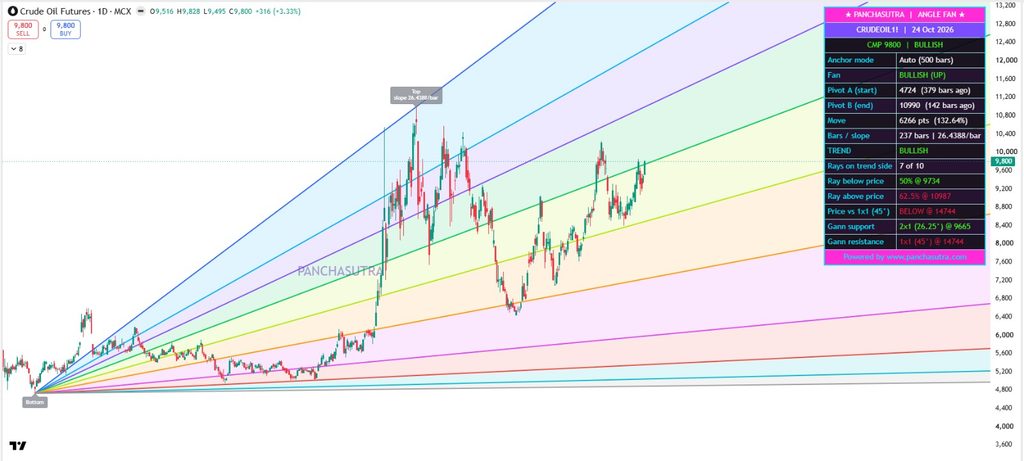
The distinction is particularly valuable when evaluating corrections within established bullish or bearish trends.
4. Trend Line Channels: Measuring the Rhythm of Price
Markets rarely move in perfectly straight lines. Even powerful trends experience temporary corrections, consolidation, and changes in momentum.
This is where trend channels become valuable.
A rising channel is generally constructed using a supporting trend line beneath successive higher lows and a parallel boundary near important highs.
Similarly, a falling channel is constructed around lower highs and lower lows.
Channels provide a structured way to observe price movement.
When price repeatedly moves between the boundaries of a channel, traders can assess whether the existing trend remains orderly.
A movement toward the upper boundary may indicate expanding bullish momentum, while a retreat toward the lower boundary may represent a corrective phase.
Gann’s angular framework can complement channel analysis by identifying whether the rate of price movement is increasing or decreasing over time.
An important observation is that a market can remain bullish even while its upward momentum is slowing.
Recognising this difference helps traders avoid confusing normal corrections with major trend reversals.
5. Trend Line Breakouts: When Market Geometry Changes
One of the most closely watched developments in technical analysis is the breaking of an established trend line.
A trend line breakout can signal that the previous balance between buying and selling pressure is changing.
From a Gann-inspired perspective, such a break may also suggest that price is departing from its previous rate of movement relative to time.
However, not every breakout is meaningful.
Temporary violations, false breakouts, and rapid recoveries occur frequently, particularly in volatile markets.
At Panchasutra, we believe that a trend line breakout deserves greater attention when supported by additional evidence:
- A decisive candle close beyond the trend line.
- Expansion in trading volume or participation.
- Confirmation from market structure, including higher highs or lower lows.
- Supporting momentum indicators such as RSI, DMI, or ADX.
- Successful retesting of the broken trend line or a relevant price zone.
- Alignment with important price levels and time-cycle observations.
The objective is not to anticipate every breakout but to distinguish meaningful structural changes from ordinary market noise.
A broken trend line is an alert. Price confirmation is the evidence.
6. The Relationship Between Trend Lines and Time Cycles
One of the most interesting aspects of Gann’s work was his emphasis on time.
Conventional technical analysis often concentrates primarily on price levels. Gann’s methods encouraged traders to examine when important price developments occur.
In this framework, a market approaching a significant trend line during an identified time-cycle window becomes an area of heightened observation.
For example, consider a market approaching a rising support line after several sessions of correction.
If this event coincides with a previously identified time-cycle window, a trader may monitor the subsequent price action more closely.
A bullish reversal candle, improvement in momentum, and successful defence of support could strengthen the technical case for a continuation.
Alternatively, a decisive breakdown could indicate that the existing trend structure is deteriorating.
The important distinction is that time-cycle analysis identifies a period to observe, while price action helps determine the direction.
Gann-inspired time-cycle techniques remain interpretive methods rather than scientifically established predictors of market turning points. Their effectiveness should be evaluated through historical testing and disciplined risk management.
7. Why Trend Lines Are Important for Every Trader
Trend lines offer a practical advantage because they help transform complex price fluctuations into a more understandable structure.
They can help traders avoid entering against a dominant trend, identify potential support and resistance areas, monitor changes in momentum, and establish logical reference points for trade management.
More importantly, trend lines encourage objective observation.
Instead of reacting emotionally to every candle, a trader can evaluate whether the market continues to respect its prevailing structure.
When combined with Gann angles, trend channels, price levels, and time-cycle analysis, they can form part of a comprehensive technical framework.
Nevertheless, no trend line or geometric angle should be treated as an infallible trading signal.
Markets are influenced by liquidity, institutional activity, economic developments, investor sentiment, and unexpected events.
Geometric analysis can organise market information, but it cannot eliminate uncertainty.
8. The Panchasutra Perspective: Geometry, Discipline and Confirmation
At Panchasutra Trading Co., our approach to technical analysis is based on studying the interaction between price, time, trend, and momentum.
We regard trend lines and Gann geometry as complementary analytical tools.
Trend lines help us identify the market’s prevailing direction. Gann angles provide a framework for studying the rate of movement. Time-cycle analysis helps identify periods that may deserve closer observation.
Momentum indicators and price action then provide additional evidence for evaluating possible trading opportunities.
Our philosophy is simple:
Price establishes the direction. Time provides context. Geometry defines the structure. Discipline governs the trade.
A trader does not need to forecast every market movement. The greater objective is to recognise the prevailing structure, wait for confirmation, and manage risk when conditions change.
Conclusion: The Market Has a Structure—Learn to Read It
The true power of trend lines lies in their simplicity.
A carefully drawn trend line can reveal the direction of a market, highlight important areas of support or resistance, and provide early warning of structural changes.
W.D. Gann’s geometric approach adds another perspective by encouraging traders to examine not only how far price has travelled but also how much time that movement has required.
The combination of price, time, and geometry offers a disciplined way to study market behaviour.
Yet successful trading ultimately depends not on the complexity of analytical tools but on the consistency with which they are applied.
At Panchasutra, we believe that the purpose of technical analysis is not to predict the future with certainty, but to prepare intelligently for the possibilities ahead.
PANCHASUTRA TRADING CO.
RULES • STRATEGY • DISCIPLINE • PEACE & PROFITS
“Don’t predict the market. Follow it.”
Explore Gann Geometry, Trend Analysis and Advanced Trading Education
Disclaimer
This article is published exclusively for educational and informational purposes. References to W.D. Gann’s methods, geometric analysis, and time cycles describe technical frameworks and do not imply guaranteed predictive accuracy. Panchasutra Trading Co. is not a SEBI-registered investment adviser or research analyst. Nothing in this article constitutes investment advice, a trading recommendation, or an assurance of profit. Financial-market trading involves risk. Readers should conduct independent research and consult a qualified professional where appropriate.