




The Hidden Rhythm of Mercury Retrograde: Why Nifty, Bank Nifty, Gold, Silver and Global Markets May Enter Their Most Explosive Phases
An exploration of Budha Vakri, planetary time cycles, volatility expansion, trend acceleration and the ancient wisdom of financial astrology.
By Panchasutra Trading Co.
“Mercury Retrograde may not tell us whether the market will rise or fall. Its greater significance may lie in identifying when the market is preparing to move.”
— Panchasutra Market-Cycle Philosophy
In financial markets, some of the most extraordinary opportunities emerge not when everything is calm, but when the established rhythm of price begins to change.
A quiet market suddenly becomes aggressive. An index that has spent several sessions moving sideways breaks into a powerful trend. Gold accelerates beyond a familiar resistance. Silver begins making unusually large candles. Banking stocks experience sharp changes in momentum, while currency markets react violently to changing expectations.
What causes these transitions?
Conventional financial analysis examines liquidity, monetary policy, earnings, institutional flows, interest rates and economic developments. Technical analysis studies price, volume, momentum and market structure.
Financial astrology introduces another dimension: time.
Among the planetary cycles studied by financial astrologers, Mercury Retrograde occupies a particularly interesting position.
Mercury, known as Budha in Vedic astrology, is traditionally associated with commerce, intelligence, calculation, communication, negotiation, exchange and the transmission of information.
These are also essential functions of modern financial markets.
The intriguing proposition is not necessarily that Mercury Retrograde produces falling markets. Rather, it is that its stationary and retrograde phases may coincide with changes in market behaviour—particularly volatility, directional acceleration, trend exhaustion and the emergence of new price structures.
At Panchasutra, this leads us to a hypothesis worth investigating:
Mercury Retrograde may be more useful as a potential market-activity and timing indicator than as a simple bullish or bearish signal.
That distinction changes the entire analytical approach.
1. Understanding Mercury Retrograde: astronomy meets ancient Jyotish
Mercury completes its orbit around the Sun in approximately 88 Earth days. Because Mercury and Earth travel around the Sun at different speeds, Mercury periodically appears to reverse direction against the background stars when observed from Earth.
This is called apparent retrograde motion. The planet does not physically reverse its orbit.
The Planetary Society
In Vedic astrology, this apparent backward movement is called Budha Vakri.
Traditionally, Mercury governs intellect, trade, accounting, speech, documentation, commerce and analytical reasoning.
In a modern market interpretation, those symbolic associations can be extended to price discovery, investor communication, speculative positioning, financial transactions and the processing of economic information.
However, symbolic correspondence is not proof of a physical or statistical influence on asset prices. That relationship must be examined through market data.
2. The current Mercury Retrograde: October–November 2026
Retrograde begins
24 Oct 2026
12:43 PM IST, approximately
Direct motion resumes
13 Nov 2026
9:24 PM IST, approximately
The current retrograde lasts approximately 20 days. In the tropical zodiac Mercury travels backward through Scorpio, while sidereal Vedic calculations place the movement in Tula (Libra). These are different zodiac reference systems, not conflicting observations of the planet.
For financial astrologers, four periods deserve attention:
- Pre-retrograde shadow: A preparatory phase in which Mercury enters the degrees it will later revisit.
- Retrograde station: Mercury’s apparent longitudinal movement slows to zero before reversing.
- Retrograde journey: The interval during which the planet appears to travel backward.
- Direct station and post-shadow: The planet resumes direct motion and eventually moves beyond the earlier station degree.
In a market-cycle framework, the two stations can be treated as observation windows, rather than automatic trading signals.
The central research question is whether market volatility, trend strength or the frequency of significant turning points increases around these dates.
3. The great misconception: Mercury Retrograde does not necessarily mean bearish markets
A widespread astrological belief associates retrograde motion with setbacks, confusion and reversals.
But markets do not operate according to such a simple interpretation.
A reversal can be bullish. A sudden acceleration can occur in either direction. A market can also remain strongly directional throughout an entire retrograde period without reversing.
Consider three hypothetical scenarios.
Scenario A — Bullish acceleration: Nifty has consolidated for several weeks beneath resistance. During a Mercury Retrograde observation window, price breaks resistance, volume expands and momentum strengthens. The relevant signal is the confirmed breakout, not the planetary event alone.
Scenario B — Bearish impulse: Bank Nifty is already structurally weak. Support breaks, negative directional movement increases and volatility expands. The retrograde period coincides with an acceleration of the existing downtrend.
Scenario C — Trend exhaustion: Gold has advanced sharply and becomes extended. Around a Mercury station, it forms a failed breakout and breaks a rising trendline. This may identify a reversal candidate, but confirmation must come from price action.
These scenarios illustrate a crucial principle:
Direction and activity are two different market variables.
A planetary timing hypothesis might appear successful at identifying active periods while having little ability to predict whether prices will rise or fall.
This is precisely why your observation about trending and impulsive markets deserves a dedicated research approach.
4. What does published financial research actually reveal?
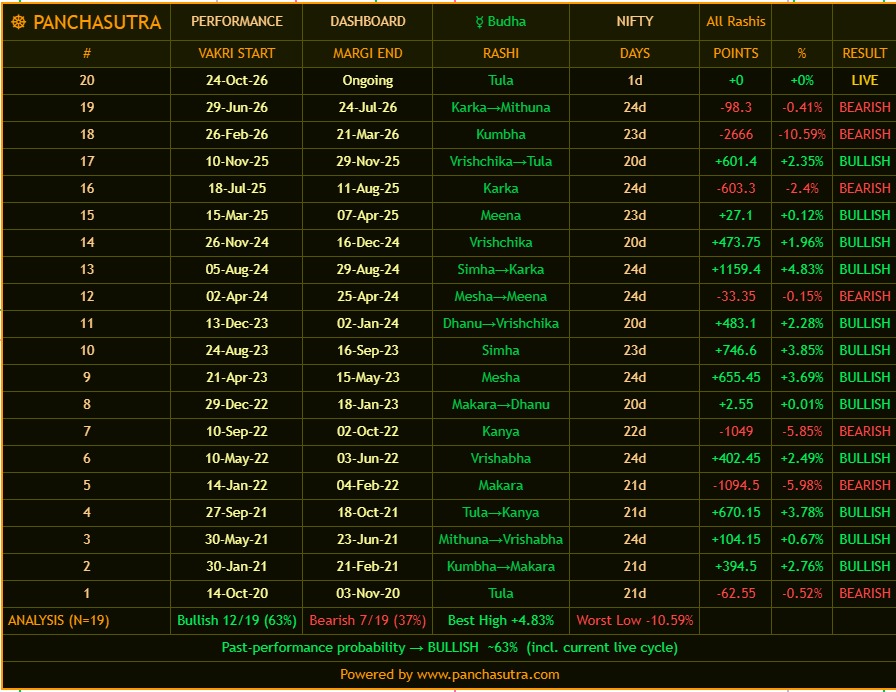
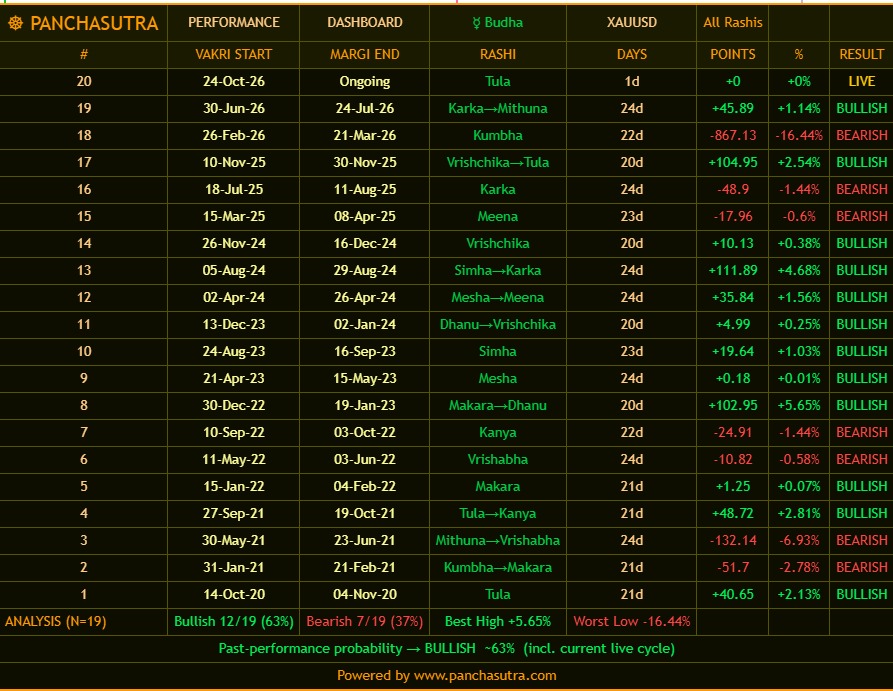
An Indian study published in Asia-Pacific Financial Markets examined Mercury Retrograde and the Nifty 50 and BSE Sensex using daily market data from 1998–2018. The authors reported a positive association with market returns and evidence of asymmetric return behaviour. This is relevant to Indian markets, although it does not establish that Mercury caused those movement.
A separate 2026 study examining equity indices across 48 countries over 1973–2025 reported that returns during retrograde periods were lower by 3.47 percentage points on an annualized basis relative to other periods. Its proposed explanation focused on investor beliefs and sentiment rather than a physical planetary influence.
ScienceDirect
Another historical study of 79 Mercury Retrograde cycles found that the average bearish tendency was modest and heavily affected by the market crashes of 2008 and 2020. More than half the examined cycles actually coincided with positive market returns.
Modern Vedic Astrology
These findings are not identical. Their markets, samples and statistical methods differ.
Most importantly, none of these results establishes that Mercury Retrograde reliably produces stronger trends or larger intraday impulses in Nifty, Bank Nifty or metals.
That specific proposition needs to be tested separately.
5. Mercury Retrograde and Nifty 50: the battle between trend and transition
The Nifty 50 represents a broad collection of major Indian companies, making it a useful instrument for examining changes in market-wide behaviour.
From a financial-astrology perspective, three potential characteristics deserve examination during retrograde periods.
First: volatility expansion. A previously narrow daily range may expand as the index begins moving beyond established support or resistance.
Second: directional persistence. Rather than merely reversing, Nifty may continue an existing trend with stronger candles and fewer meaningful pullbacks.
Third: trend transition. A prolonged bullish or bearish phase may lose momentum around a station window, producing a new directional structure.
The key is to distinguish a genuine impulse from an ordinary intraday fluctuation.
For example, a bullish impulse becomes more convincing when price closes above a significant resistance, RSI sustains above 60, +DI dominates -DI and the breakout is supported by participation.
Conversely, RSI below 40, negative DMI dominance and a decisive support breakdown would favour a bearish interpretation.
Mercury provides the proposed time window. Price supplies the verdict.
6. Bank Nifty: where momentum can become exceptionally aggressive
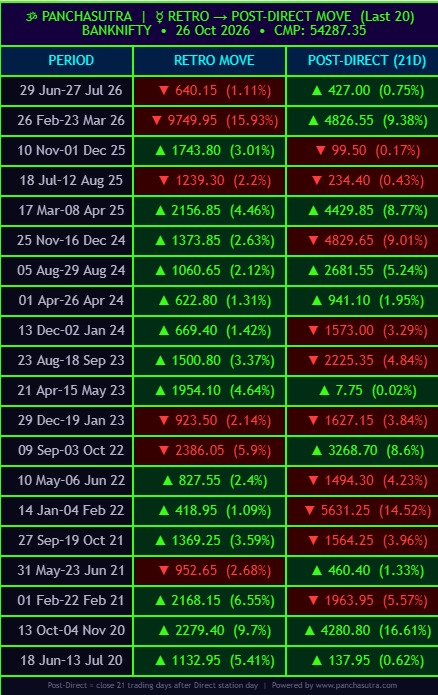
Bank Nifty deserves special attention because banking stocks respond to a complex combination of interest-rate expectations, liquidity, credit conditions, bond yields, regulation and institutional positioning.
The symbolic association of Mercury with commerce and financial transactions makes banking an interesting sector for astrological research.
Yet the actual reason Bank Nifty can exhibit aggressive movements is its sector concentration and sensitivity to financial conditions—not an established planetary mechanism.
During Mercury Retrograde, a researcher could examine whether Bank Nifty displays:
- Larger daily and intraday ranges relative to its normal volatility.
- More frequent opening-range breakouts.
- Stronger directional movement after the first hour.
- A greater number of failed breakouts or sudden reversals.
- Unusual relative strength or weakness against Nifty 50.
One particularly valuable measure would be the Bank Nifty/Nifty relative-strength ratio.
If Bank Nifty begins outperforming while both indices are advancing, it may indicate banking-led bullish momentum. If Bank Nifty underperforms during a broader market decline, it may reveal concentrated financial-sector weakness.
These are testable market observations, not predetermined Mercury effects.
7. Gold: Mercury, monetary expectations and the psychology of uncertainty
Gold is one of the most fascinating instruments for financial-cycle analysis.
Its price reflects real interest rates, the US dollar, geopolitical uncertainty, central-bank activity, investment demand and global liquidity expectations.
From a traditional astrological perspective, gold is more commonly associated with the Sun and Jupiter than Mercury.
Why study Mercury, then?
Because Mercury’s symbolism relates to information, trade and communication—factors that can influence how investors interpret monetary developments.
A surprise inflation report, a change in central-bank language or a shift in bond-market expectations can rapidly alter gold’s price structure.
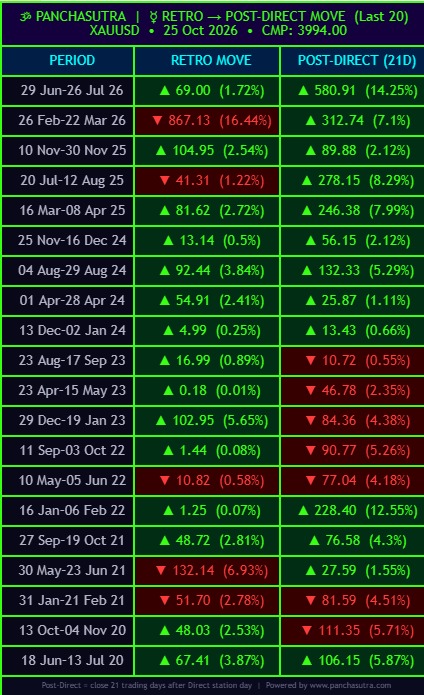
For a Mercury-cycle study, the important questions are whether gold experiences unusual range expansion, more frequent breakout failures or greater trend persistence near Mercury stations.
An especially useful distinction is between volatility caused by known macroeconomic events and volatility that remains unusual after those events are accounted for.
Without that separation, a researcher may mistakenly attribute a central-bank-driven rally to an astrological event.
8. Silver: the instrument where impulse deserves special study
Silver combines precious-metal characteristics with substantial industrial demand.
Its sensitivity to both investment flows and economic expectations makes it particularly interesting during periods of changing market sentiment.
A silver rally may accelerate when precious metals strengthen and industrial-demand expectations improve simultaneously. Conversely, weakness in both factors can intensify selling pressure.
Within a Mercury Retrograde framework, silver could be tested for unusually strong directional candles, repeated support-resistance breaks and elevated volatility relative to gold.
The gold/silver ratio provides another valuable analytical dimension.
A falling ratio can indicate silver outperforming gold, while a rising ratio indicates gold outperforming silver.
If a Mercury-cycle observation coincides with a significant ratio breakout, it may signal a broader change in metals-market leadership.
But that relationship must be demonstrated historically before being treated as a repeatable pattern.
9. Copper, crude oil and natural gas: testing the wider commodity universe
The Mercury Retrograde hypothesis should not be restricted to equities and precious metals.
Copper is sensitive to industrial activity, Chinese demand, supply disruptions and the US dollar. Crude oil responds to geopolitical developments, production policy, inventories and economic expectations. Natural gas has its own highly seasonal dynamics, including weather, storage and supply conditions.
These differences are important.
If Mercury Retrograde is genuinely associated with increased market activity, we should investigate whether the effect appears consistently across unrelated instruments—or only in certain asset classes.
For example, if Nifty, copper and crude oil all display elevated volatility around a Mercury station, that might suggest a broad timing relationship worth investigating.
However, if crude oil’s entire movement can be explained by a major supply disruption, the event cannot reasonably be treated as evidence of a Mercury effect.
A serious financial astrologer must distinguish correlation, coincidence and causation.
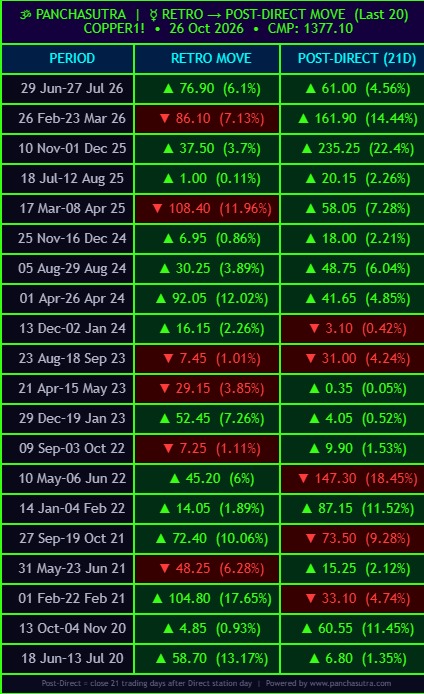
10. Which instruments deserve the closest attention?
The following table presents research priorities based on each instrument’s market characteristics and the proposed Mercury-cycle hypothesis. These are not established astrological performance rankings.
| Instrument | What to investigate | Important confirmation |
|---|---|---|
| Nifty 50 | Trend initiation, range expansion | RSI, ADX, price structure |
| Bank Nifty | Impulse strength, leadership changes | Relative strength, DMI |
| Gold | Reversals, breakout continuation | Dollar, yields, support/resistance |
| Silver | Volatility expansion, directional impulse | Gold/silver ratio, ATR |
| Copper | Trend acceleration | Industrial demand, dollar |
| Crude oil | Momentum bursts and reversals | Inventories, geopolitical events |
| Natural gas | Extreme-range behaviour | Weather, storage, ATR |
| USD/INR | Currency trend changes | DXY, RBI, capital flows |
| IT sector | Sensitivity to communication and technology themes | Nasdaq, USD/INR, earnings |
| Financial services | Sector rotation and trend strength | Rates, liquidity, credit conditions |
11. Mercury stations: could the turning point matter more than the retrograde itself?
This may be the most interesting part of the entire subject.
A retrograde period lasts approximately three weeks, but a stationary event occurs at a much more precise astronomical moment.
For a time-cycle trader, precision is valuable.
Instead of assuming that every trading session within a retrograde period should be volatile, we can examine whether significant market movements cluster around the stationary dates.
Consider three separate windows:
- The three trading sessions before and after the retrograde station.
- The middle portion of the retrograde journey.
- The three trading sessions before and after the direct station.
These windows should be evaluated independently.
Perhaps the stations correspond with changes in market direction. Perhaps the middle phase shows stronger trend continuation. Or perhaps neither relationship survives statistical testing.
All three outcomes would be valuable research findings.
In a Gann-inspired approach, the station dates become potential time coordinates, while support, resistance, angles and price geometry remain essential for establishing direction.
This is consistent with one of the central principles of market geometry: time and price must be studied together.
12. The Panchasutra Mercury Impulse Framework
To turn an interesting astrological observation into a disciplined market-study methodology, I propose a five-stage framework.
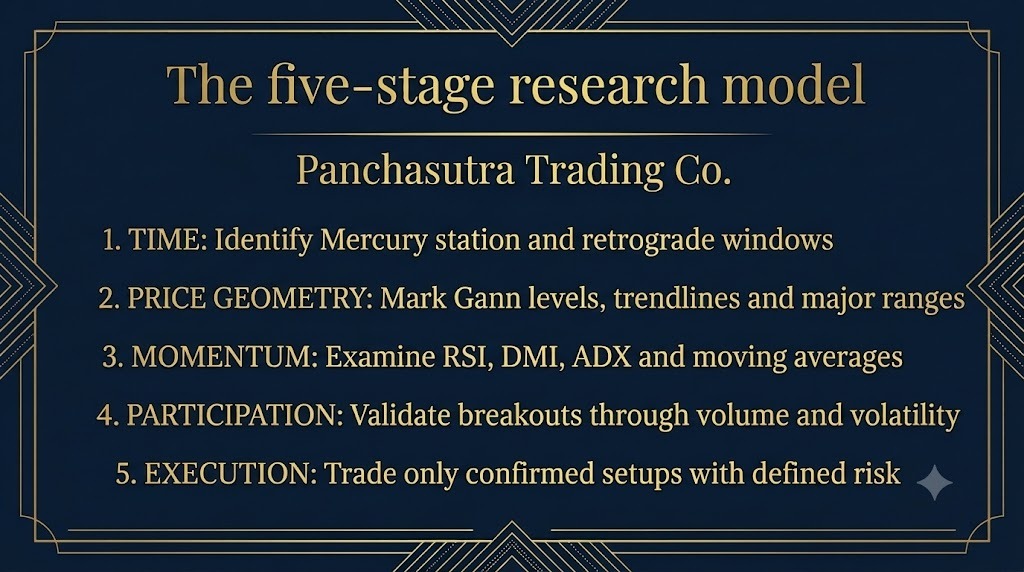
This framework makes an important distinction: an astrological observation is not itself a trade entry.
A possible bullish setup requires a price breakout and confirmation from momentum and market structure. A bearish setup requires equivalent evidence in the opposite direction.
An unsuccessful breakout, even during a theoretically favourable time window, should be treated as an unsuccessful trade setup—not as a reason to disregard risk management.
13. How can we scientifically test the Mercury impulse hypothesis?
Here is where Panchasutra could make a meaningful contribution to financial-astrology research.
Rather than merely collecting examples of spectacular market movements, we should test every Mercury Retrograde period over a substantial historical sample.
For Nifty, Bank Nifty, gold, silver, copper and crude oil, we could measure four primary outcomes.
Volatility expansion: Compare average true range during retrograde windows with equivalent non-retrograde windows.
Trend strength: Examine ADX, directional efficiency and the percentage of sessions showing sustained directional movement.
Impulse frequency: Measure the proportion of sessions in which the absolute daily return exceeds a predetermined multiple of recent volatility.
Turning-point frequency: Count confirmed swing highs and swing lows occurring within a fixed number of sessions around Mercury stations.
The experiment must also control for economic announcements, expiry effects, weekday patterns, market regimes and overlapping planetary events.
A particularly important safeguard is to compare results with randomly selected windows of equal length and use out-of-sample testing.
Without those controls, the apparent success of an astrological timing model could simply reflect selection bias.
The outcome could support your observation, weaken it or show that the relationship applies only to certain instruments and market conditions.
That is what would make the findings genuinely valuable.
14. A special observation for October–November 2026
The present retrograde provides a timely opportunity to begin such a study.
With Mercury turning retrograde on October 24 and returning to direct motion on November 13, the next three weeks form a clearly defined observation period.
For Indian markets, I would concentrate on Nifty and Bank Nifty directional movement, gold and silver volatility, the behaviour of USD/INR and relative strength across major sectors.
Rather than publishing a predetermined bullish or bearish forecast, we can monitor whether the market moves from compression into expansion, whether existing trends accelerate and whether the stationary dates coincide with confirmed turning points.
The objective is not to force the market into an astrological interpretation.
It is to observe whether the astrological calendar offers additional timing information beyond what price and conventional market indicators already provide.
15. The final perspective: perhaps the real secret is not direction, but intensity
Financial astrology becomes most intellectually interesting when we stop asking only whether a planet is bullish or bearish.
Markets are multidimensional. They move through cycles of accumulation, distribution, compression, expansion, acceleration and exhaustion.
A successful timing methodology would ideally help identify transitions between those phases.
Your observation that Mercury Retrograde often accompanies active, trending and impulsive markets is therefore a more sophisticated hypothesis than the traditional claim that retrograde periods are inherently negative.
It invites a different question:
Does Mercury Retrograde coincide with an increase in the intensity of market movement, regardless of its direction?
That question is measurable.
And if repeated historical testing eventually demonstrates a statistically meaningful relationship, the finding could become a useful supplementary component of a broader market-cycle framework.
Until then, it remains an intriguing hypothesis rather than a proven trading edge.
The Panchasutra closing thought
“A market does not reward us for knowing when a planet changes direction. It rewards us for recognising when price changes behaviour.”
Time may invite us to watch. Geometry may reveal the levels. Momentum may confirm the opportunity. But discipline must always determine the trade.
At Panchasutra, our guiding principle remains:
Don’t predict the market. Follow it.
Rules • Strategy • Discipline • Peace & Profits
PANCHASUTRA TRADING CO.
Disclaimer: This article explores financial astrology as an educational and research framework. Astrology has no established causal mechanism for predicting financial-market movements. The hypotheses and scenarios discussed are not investment advice or assurances of future performance. Trading and investing involve financial risk; readers should conduct independent research and apply appropriate risk management.