
As they say, things rarely turn out the way we expect them to. And when it comes to the stock market, this statement couldn’t be more accurate.
Let’s take a moment to look back.
“When NIFTY was struggling around the 22,200–22,400 levels (Spot), almost every discussion across social media, trading communities, television channels and market forums revolved around one common expectation: NIFTY was heading towards 20,000, possibly even lower.“
I am referring specifically to NIFTY Spot levels.
There was hardly anyone talking about a meaningful recovery. Perhaps a few voices existed, but they certainly weren’t prominent enough to challenge the overwhelming market narrative. The widely accepted belief was that NIFTY would eventually break its recent lows and move significantly lower.
But what actually happened?
The exact opposite!
The market staged an extraordinary rally, an unprecedented move that has taken even the most experienced market participants by surprise.
And now, when NIFTY is trading more than 3,000 points above its recent lows, the narrative has completely changed.
Suddenly, everyone seems convinced that fresh all-time highs are just around the corner. BANK NIFTY has already come remarkably close to achieving that milestone.
But here is the question:
Does the market always behave the way the majority expects it to?
Will this rally sustain? Have the bears already been trapped? Have all the underlying concerns suddenly disappeared?
Have the ground-level economic and market-related problems that we were repeatedly hearing about been magically resolved?
And perhaps the most important question of all:
Are investors’ portfolios performing as impressively as the benchmark indices suggest?
When I try to find answers to these questions, I am afraid my conclusion is not particularly encouraging.
NO.
We are still dealing with many of the same underlying concerns. The ground reality has not changed nearly as much as the market indices suggest.
So, what exactly is this extraordinary rally?
Is it the final burst of energy before the flame goes out? Is it the excitement before a much bigger storm? Or is there something else unfolding beneath the surface?
When I fail to find convincing answers in the charts alone, I turn my attention towards planetary alignments and astrological time cycles.
And what I am observing there deserves serious attention.
I am witnessing a series of significant planetary movements and alignments that, in my interpretation, could indicate the possibility of considerable turbulence ahead.
And obviously, when I use the word STORM, I am certainly not referring to something particularly pleasant.
So, let’s examine what has unfolded over the last 4–5 days and, more importantly, what lies ahead.
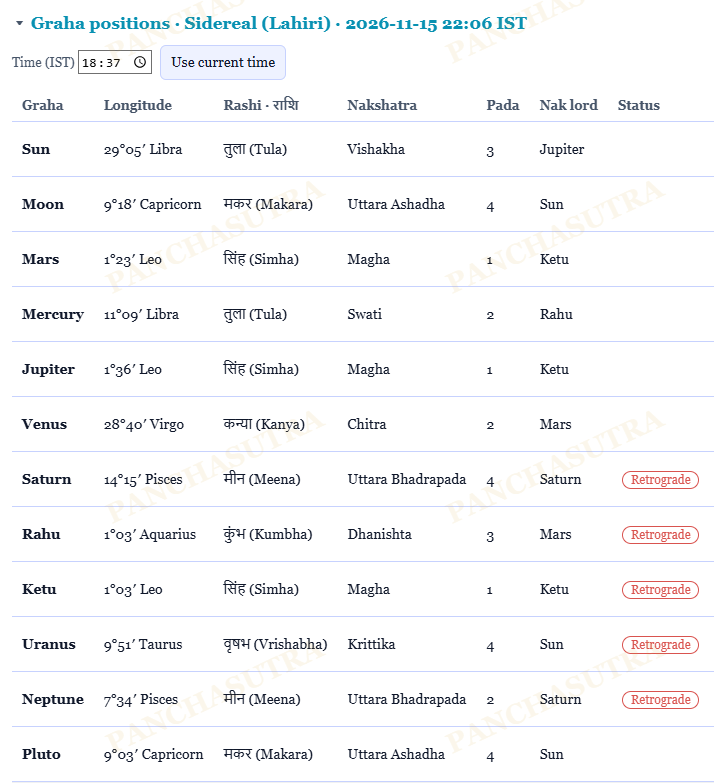
MAJOR ASTROLOGICAL EVENTS AROUND 16 NOVEMBER 2026
The following events are taking place within the next 3–4 days:
- Gand Yoga concludes and Vriddhi Yoga begins.
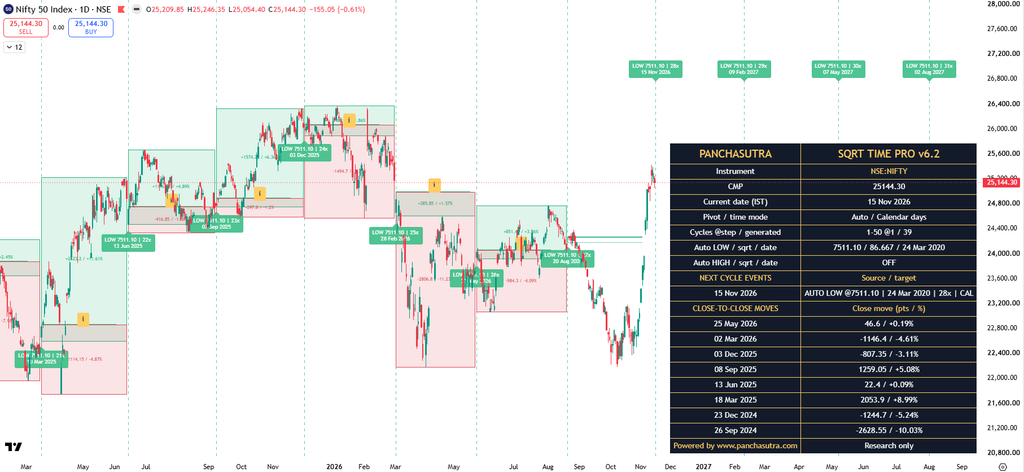
- Gann Price Square Time Cycle.
- Jupiter conjunct Ketu.
- Uranus enters Krittika Nakshatra, Pada 4.
- Mercury turns direct.
- Mars enters Leo and Magha Nakshatra, Pada 1.
- Sun enters Vishakha Nakshatra, Pada 3.
- Mars–Jupiter Graha Yuddha begins.
- Venus turns direct.
- Mars joins Jupiter and Ketu, bringing all three planetary bodies together in the same sign/house.
- Sun enters Scorpio.
- And last, but certainly not least, ABHIJIT NAKSHATRA.
THE FOLLOWING IMAGE DISPLAYS THE MOVES NIFTY HAS SHOWN FROM ITS LAST GANN PRICE SQUARE TIME EVENT DATES.
16 NOVEMBER 2026: A DATE THAT DESERVES OUR ATTENTION
When the market opens on 16 November, it will be carrying the influence of several significant astrological events and planetary configurations.
There is one historical observation that I particularly want everyone to remember.
Whenever I have studied some of the major historical market crashes, one recurring planetary configuration has caught my attention: JUPITER PLACED IN KETU’S NAKSHATRA.
This is an observation worth examining closely, especially in the context of the planetary alignments unfolding around 16 November.
Does this necessarily mean that a major crash is imminent? Not necessarily.
But does it mean we should blindly assume that everything is fine simply because the market has rallied sharply? Absolutely not.
The objective is not to predict a crash or create panic. It is to remain alert when the market’s optimism appears disconnected from the underlying reality.
Remember: The market does not owe us an explanation, nor does it have any obligation to follow the consensus.
Sometimes, the biggest risks emerge precisely when everyone believes the danger has passed.
NIFTY SPOT: THE LEVELS THAT MATTER
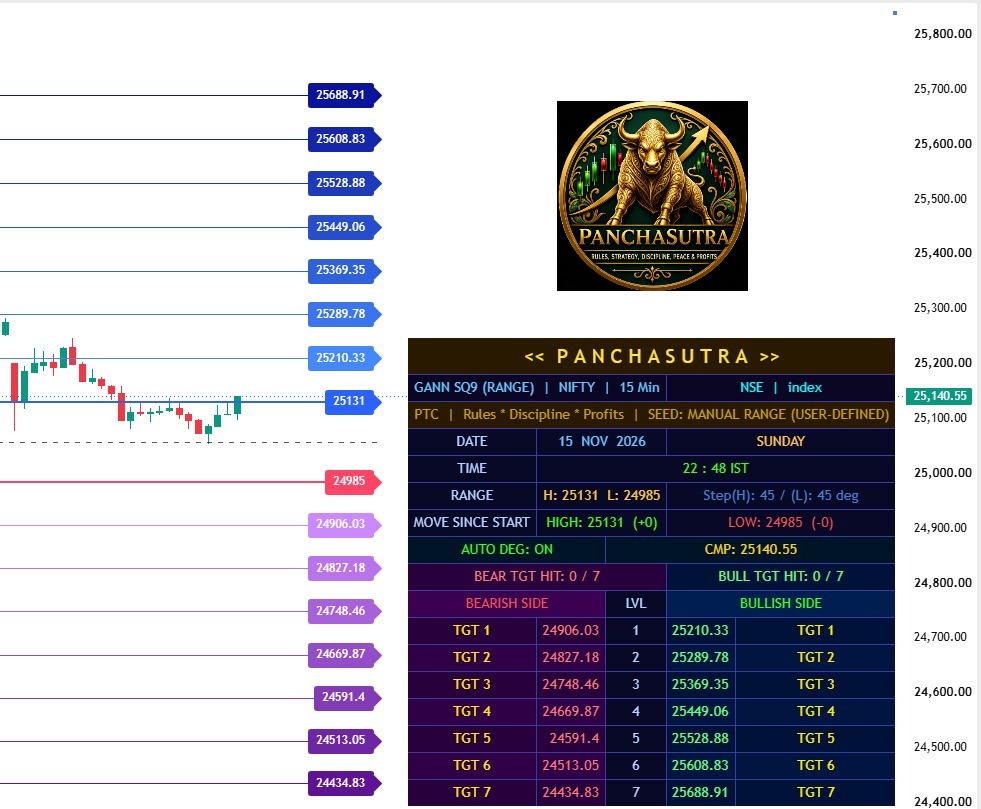
Coming to NIFTY Spot, 24,985 is a crucial level that deserves our attention.
As long as NIFTY continues to trade above 24,985, we maintain our view that the prevailing bullish momentum remains intact.
However, if the market starts trading below the 24,985–25,131 range and subsequently gives a closing below this zone, it would, according to our analysis, be the first significant indication of a potential trend reversal.
The first 15-minute candle on Monday, 16 November, will also play a very important role in determining the market’s immediate direction.
Why is 16 November so important?
Because it is not just another trading session.
It is the first trading day following several significant planetary developments taking place on 13, 14 and 15 November. More importantly, it also coincides with an important GANN PRICE SQUARE TIME date.
With ABHIJIT NAKSHATRA adding further significance to this date, I believe the price range established around this session could prove decisive for the market over the coming days and potentially beyond.
MARK THIS DATE. YOU WILL UNDERSTAND ITS SIGNIFICANCE AS EVENTS UNFOLD.
The conjunction of Jupiter with Ketu, Mars joining Ketu, and multiple major planetary bodies gathering in the same sign/house are configurations that, in my interpretation, indicate the possibility of a significant market movement.
The direction and magnitude will ultimately have to be confirmed by price action.
And this brings me to something I have always believed in:
PRICE TELLS US WHAT IS HAPPENING. TIME TELLS US WHEN IT IS LIKELY TO HAPPEN.
Time is as important as price.
No trader or investor should casually dismiss the potential role of astrological time cycles in understanding market behaviour.
In fact, I would go a step further.
Even the greatest talent, the finest strategy and the best of abilities can fail to deliver their true potential if the timing is not right.
An extraordinary opportunity can pass unnoticed. A brilliant strategy can fail to find the right environment. And even the most capable individual may struggle to reach the stage when time itself is not supportive.
That is why our elders have always said:
SAMAY BADA BALWAN.
TIME IS THE ULTIMATE FORCE.
The market may reward your analysis, but it is often timing that determines whether that analysis translates into an opportunity.
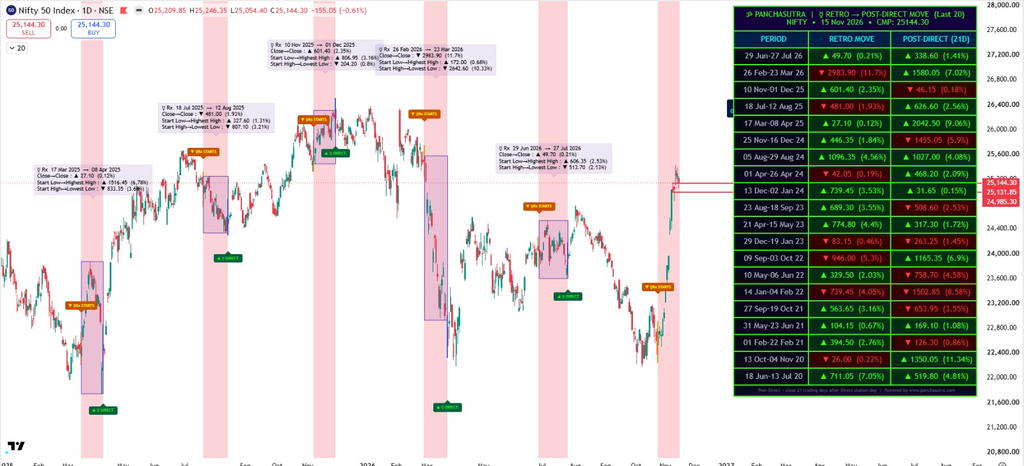
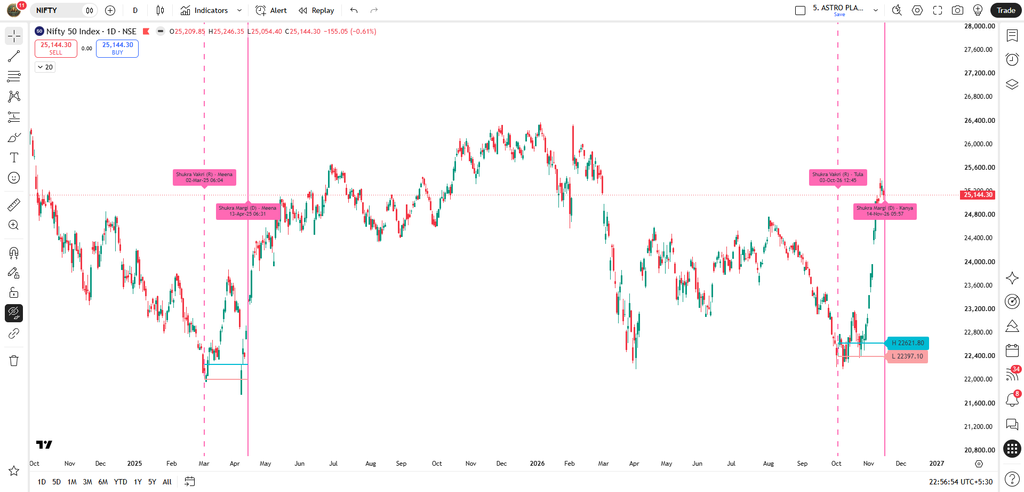
MERCURY AND VENUS TURN DIRECT: A POTENTIAL MARKET TURNING POINT?
The transition of Mercury and Venus from their respective retrograde phases into direct motion is another development that deserves our attention.
Planetary stations and changes in motion have often been observed as potentially significant time-cycle events in market studies.
It will be particularly interesting to observe how the upcoming direct motion of Mercury, followed by Venus emerging from its retrograde phase and resuming regular direct motion, influences the prevailing market trend.
Will these planetary transitions act as a trigger for reversing the ongoing bullish momentum?
Or will they simply add more fuel to the existing rally?
Will the market witness a change in sentiment, or will the bulls continue to dominate?
This is something worth watching very closely over the coming sessions.
Now, take a look at the chart and the accompanying table below.
The historical data and planetary configurations presented there will allow you to form your own assessment of how much weight there may be in the observations discussed above.
Rather than relying solely on opinions, let us examine what the data has to reveal.