


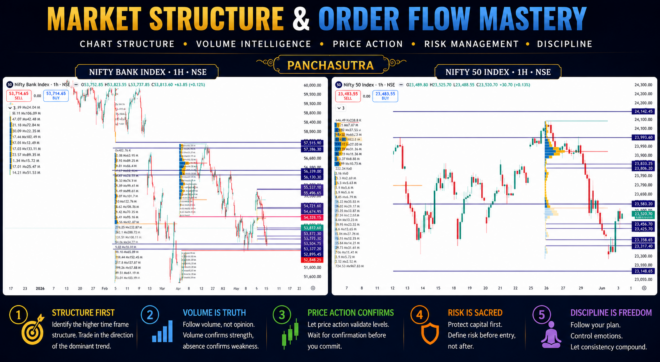
A Volume Profile Decoded — Nifty 50 & Bank Nifty’s Make-or-Break Zones for the Week Ahead
What Is Volume Profile? — The Map of Smart Money
Most traders look at price. The smart trader looks at where price spent time — and more importantly, how much business was done there. That is exactly what Volume Profile tells you.
Volume Profile is a charting tool that plots the total traded volume at each price level over a selected period, displayed as horizontal bars on the right side of the chart. Unlike traditional volume bars at the bottom which only tell you when volume happened, Volume Profile tells you where it happened — at what exact price the market conducted the most business.
“Price is what you pay. Value is what you get.” — The Volume Profile is the market’s own definition of value. Where the longest bars are, that is where the market agreed price was fair. Where bars are thin, price was rejected.
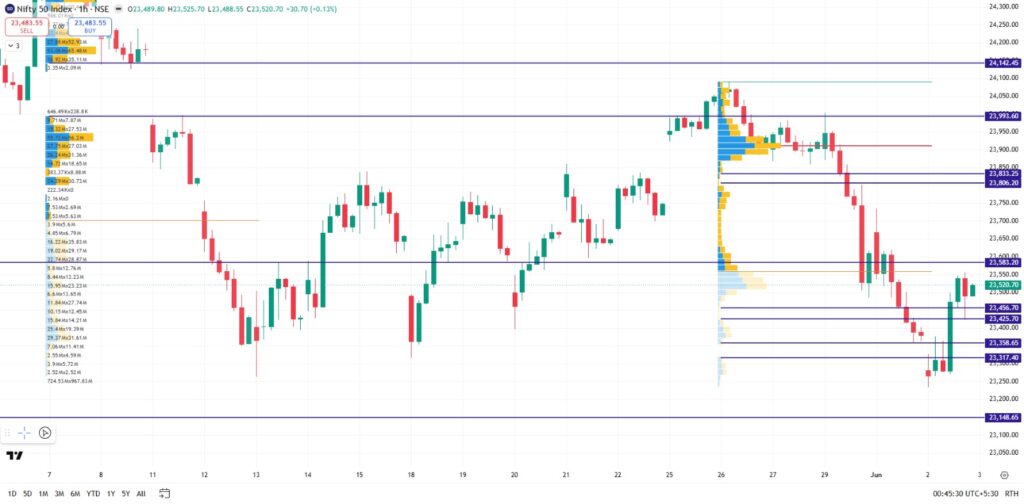
Nifty 50 — 1H Chart Analysis
NIFTY 50 INDEX
NSE · 1 Hour Timeframe · CMP 23,520.70
The Nifty 50 on the 1-hour chart paints a picture of a market at a critical inflection point. After a sharp recovery from the April lows, the index has stalled and is now consolidating near the lower end of a heavy volume cluster — a classic setup that Panchasutra traders watch closely for directional clues.
The Volume Profile reveals a massive High Volume Node between 23,500 and 23,650 — this is where the bulk of recent trading activity has occurred. The POC sits right around the 23,500–23,520 zone, which is almost exactly where the CMP is trading. This makes the current level extraordinarily significant. The market is sitting on its own centre of gravity.
The Panchasutra read on Nifty is simple: above 23,583 — bulls take control, targets open up to 23,833 and 23,993. Below 23,456, expect fast selling toward 23,317. The 23,148 level is the last major support — a breakdown below that would be structurally significant and would call for a reassessment of the broader uptrend.
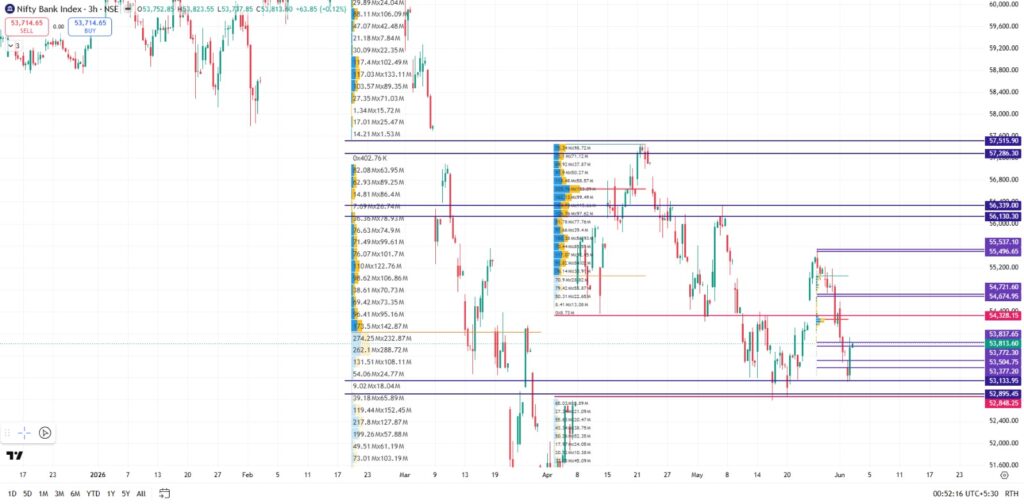
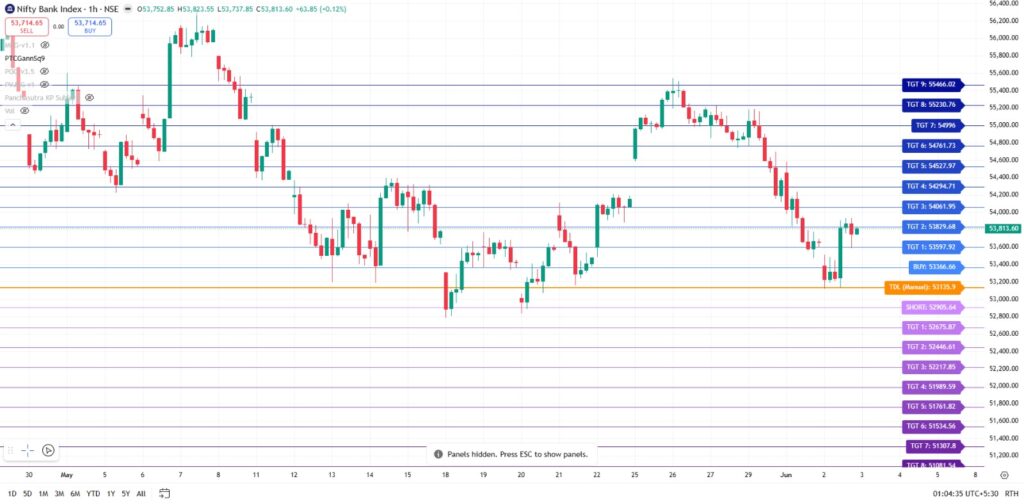
Bank Nifty — 3H Chart Analysis
NIFTY BANK INDEX
NSE · 3 Hour Timeframe · CMP 53,813.60
Bank Nifty on the 3-hour chart tells a more aggressive story. The Volume Profile here shows extreme distribution — enormous volume traded in the 53,000–56,500 range over recent months, with clear structural footprints left by institutional activity at multiple price levels.
What stands out immediately is the sharp rejection from the 57,500+ zone in late 2025, followed by a deep selloff and now a laboured recovery. The current price near 53,813 is sitting right inside a dense HVN cluster — this is a battle zone, not a trending zone. Expect choppiness until either side capitulates.
The 54,328 level is the single most important resistance on Bank Nifty right now. It has been tested and rejected multiple times, as visible in the chart. A clean close above it on the 3H timeframe would be a powerful signal — opening the path toward 55,496 and eventually 56,130.
On the downside, 53,133 is the line in the sand. Notice how thin the Volume Profile is below this level — it is a Low Volume Node, meaning if Bank Nifty slides below 53,133, there is very little support until 52,848. That is a 285-point air pocket that price can fall through rapidly.
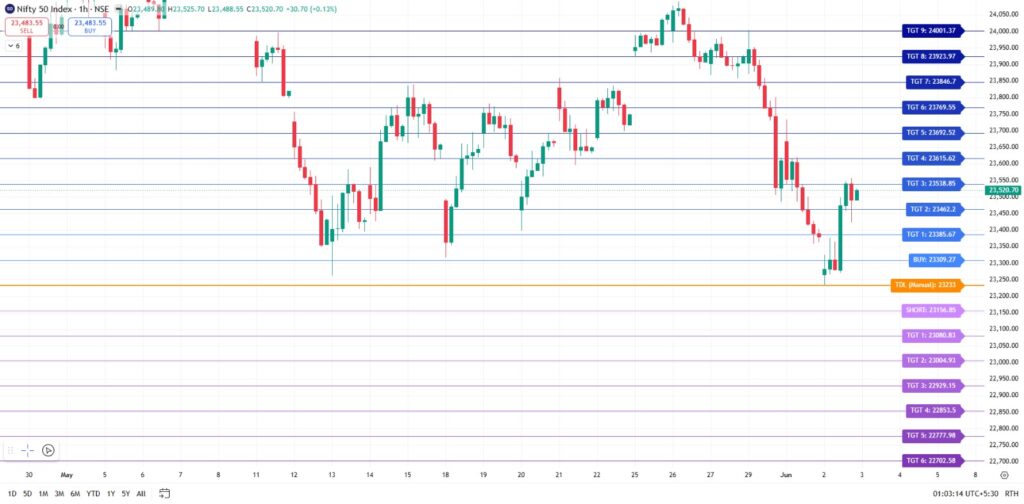
NIFTY AND NIFTY BANK IMPORTANT GANN MAZIC LEVELS
The Panchasutra Perspective — Patience Wins
Both Nifty and Bank Nifty are currently parked inside high-volume, high-liquidity zones — the kind of zones where institutions are actively absorbing supply or building fresh positions. This is not a place for impulsive trades.
The Panchasutra approach is clear: wait for the price to leave the current range with authority. A breakout above the respective resistance levels — 23,583 on Nifty and 54,328 on Bank Nifty — with volume confirmation is your go-long signal. A breakdown below 23,456 on Nifty and 53,133 on Bank Nifty is your go-short signal.
The Volume Profile has shown us exactly where the smart money has built its fortress. Our job is not to fight those walls — it is to trade with them. Know your levels. Respect the structure. Let the market come to you.